
| Name: GSC | Sequence: fasta or formatted (257aa) | NCBI GI: 27777663 | |
|
Description: goosecoid
|
Referenced in:
| ||
|
Composition:
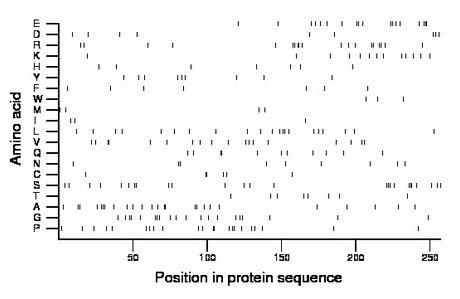
Amino acid Percentage Count Longest homopolymer A alanine 9.7 25 3 C cysteine 2.3 6 2 D aspartate 3.5 9 1 E glutamate 7.0 18 3 F phenylalanine 2.7 7 1 G glycine 7.8 20 2 H histidine 2.7 7 1 I isoleucine 1.2 3 1 K lysine 5.1 13 1 L leucine 8.2 21 2 M methionine 1.6 4 1 N asparagine 3.5 9 2 P proline 8.6 22 2 Q glutamine 4.3 11 2 R arginine 7.4 19 2 S serine 9.7 25 3 T threonine 3.1 8 1 V valine 7.0 18 2 W tryptophan 1.2 3 1 Y tyrosine 3.5 9 1 |
Comparative genomics:
Search single species RefSeq proteins at NCBI
Search summary 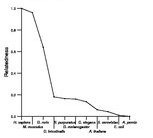
Figure data | ||
Related human proteins:Protein Relative score Description Self-match 1.000 goosecoid GSC2 0.163 goosecoid homeobox 2 PHOX2B 0.139 paired-like homeobox 2b VSX2 0.133 visual system homeobox 2 DRGX 0.133 dorsal root ganglia homeobox PHOX2A 0.129 paired-like homeobox 2a VSX1 0.125 visual system homeobox 1 isoform a ALX1 0.121 cartilage paired-class homeoprotein 1 CRX 0.121 cone-rod homeobox protein ARX 0.121 aristaless related homeobox DMBX1 0.119 diencephalon/mesencephalon homeobox 1 isoform b [Hom... DMBX1 0.119 diencephalon/mesencephalon homeobox 1 isoform a [Hom... HESX1 0.119 HESX homeobox 1 ESX1 0.117 extraembryonic, spermatogenesis, homeobox 1-like [Ho... PAX6 0.117 paired box gene 6 isoform a PAX6 0.117 paired box gene 6 isoform b PAX6 0.117 paired box gene 6 isoform a ALX4 0.117 aristaless-like homeobox 4 RAX2 0.117 retina and anterior neural fold homeobox 2 RAX 0.115 retina and anterior neural fold homeobox OTX2 0.115 orthodenticle homeobox 2 isoform b OTX2 0.115 orthodenticle homeobox 2 isoform a ALX3 0.113 aristaless-like homeobox 3 OTX1 0.113 orthodenticle homeobox 1 PAX3 0.113 paired box 3 isoform PAX3i PAX3 0.113 paired box 3 isoform PAX3g PAX3 0.113 paired box 3 isoform PAX3h PAX3 0.113 paired box 3 isoform PAX3e PAX3 0.113 paired box 3 isoform PAX3d PAX3 0.113 paired box 3 isoform PAX3Human BLASTP results (used to prepare the table) | |||
Gene descriptions are from NCBI RefSeq. Search results were obtained with NCBI BLAST and RefSeq entries. When identical proteins are present, the self-match may not be listed first in BLASTP output. In such cases, the table above has been reordered to place it first.
See About the Figures for the scoring system used in the figure above right. The same scoring system was used in the table of BLASTP results.
Guide to the Human Genome
Copyright © 2010 by Stewart Scherer. All rights reserved.
