
| Name: EPDR1 | Sequence: fasta or formatted (344aa) | NCBI GI: 24475586 | |
|
Description: ependymin related protein 1 precursor
| Not currently referenced in the text | ||
|
Composition:
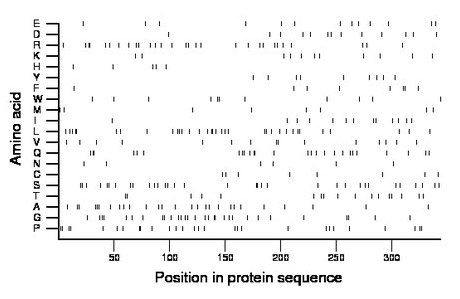
Amino acid Percentage Count Longest homopolymer A alanine 7.8 27 2 C cysteine 2.3 8 1 D aspartate 3.8 13 1 E glutamate 3.8 13 1 F phenylalanine 2.3 8 2 G glycine 8.7 30 2 H histidine 1.5 5 1 I isoleucine 3.8 13 1 K lysine 3.2 11 1 L leucine 9.9 34 2 M methionine 2.3 8 1 N asparagine 1.7 6 1 P proline 8.1 28 2 Q glutamine 7.6 26 2 R arginine 8.4 29 2 S serine 9.6 33 2 T threonine 4.9 17 1 V valine 4.4 15 1 W tryptophan 3.2 11 1 Y tyrosine 2.6 9 1 |
Comparative genomics:
Search single species RefSeq proteins at NCBI
Search summary 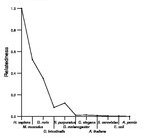
Figure data | ||
Related human proteins:Protein Relative score Description Self-match 1.000 ependymin related protein 1 precursor HRNR 0.013 hornerin EGR4 0.013 early growth response 4 LOC100291995 0.012 PREDICTED: hypothetical protein XP_002345272 LAMA5 0.012 laminin alpha 5 LOC100292568 0.012 PREDICTED: hypothetical protein LOC100291146 0.012 PREDICTED: hypothetical protein XP_002346600 LOC100289534 0.012 PREDICTED: hypothetical protein XP_002342442 LOC728650 0.010 PREDICTED: hypothetical protein LOC100129906 0.010 PREDICTED: hypothetical protein LOC100129906 0.010 PREDICTED: hypothetical protein COL4A3 0.010 alpha 3 type IV collagen isoform 5 precursor COL4A3 0.010 alpha 3 type IV collagen isoform 4 precursor COL4A3 0.010 alpha 3 type IV collagen isoform 2 precursor COL4A3 0.010 alpha 3 type IV collagen isoform 1 precursor COL17A1 0.010 alpha 1 type XVII collagen LOC100132369 0.009 PREDICTED: hypothetical protein LOC100293375 0.009 PREDICTED: hypothetical protein LOC100132369 0.009 PREDICTED: hypothetical protein LOC100287774 0.009 PREDICTED: hypothetical protein LOC100132369 0.009 PREDICTED: hypothetical protein LOC100129906 0.009 PREDICTED: hypothetical protein LOC100287774 0.009 PREDICTED: hypothetical protein XP_002342517 CXorf49 0.009 hypothetical protein LOC100130361 CXorf49B 0.009 hypothetical protein LOC100132994 ANO8 0.009 anoctamin 8 COL21A1 0.009 collagen, type XXI, alpha 1 precursor TBC1D10B 0.009 TBC1 domain family, member 10B PCDHA13 0.009 protocadherin alpha 13 isoform 1 precursor LOC100132234 0.007 PREDICTED: hypothetical protein LOC100132234Human BLASTP results (used to prepare the table) | |||
Gene descriptions are from NCBI RefSeq. Search results were obtained with NCBI BLAST and RefSeq entries. When identical proteins are present, the self-match may not be listed first in BLASTP output. In such cases, the table above has been reordered to place it first.
See About the Figures for the scoring system used in the figure above right. The same scoring system was used in the table of BLASTP results.
Guide to the Human Genome
Copyright © 2010 by Stewart Scherer. All rights reserved.
