
| Name: C1orf89 | Sequence: fasta or formatted (258aa) | NCBI GI: 241666479 | |
|
Description: hypothetical protein LOC79363
| Not currently referenced in the text | ||
|
Composition:
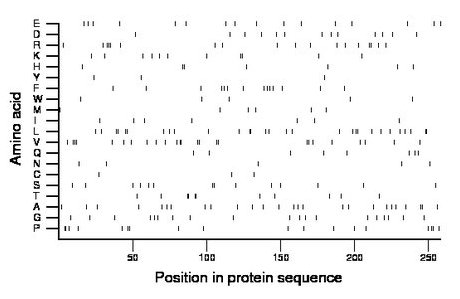
Amino acid Percentage Count Longest homopolymer A alanine 10.1 26 2 C cysteine 1.2 3 1 D aspartate 5.0 13 1 E glutamate 6.2 16 1 F phenylalanine 5.4 14 1 G glycine 7.4 19 1 H histidine 2.7 7 2 I isoleucine 2.7 7 1 K lysine 4.3 11 2 L leucine 11.2 29 2 M methionine 2.3 6 1 N asparagine 1.9 5 1 P proline 7.0 18 2 Q glutamine 3.1 8 1 R arginine 7.0 18 3 S serine 5.4 14 2 T threonine 4.3 11 2 V valine 9.7 25 3 W tryptophan 1.9 5 1 Y tyrosine 1.2 3 1 |
Comparative genomics:
Search single species RefSeq proteins at NCBI
Search summary 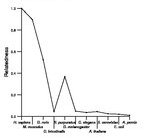
Figure data | ||
Related human proteins:Protein Relative score Description Self-match 1.000 hypothetical protein LOC79363 REM2 0.064 rad and gem related GTP binding protein 2 RAB37 0.046 RAB37, member RAS oncogene family isoform 3 RAB26 0.044 RAB26, member RAS oncogene family RAB33B 0.040 RAB33B, member RAS oncogene family RAB40C 0.038 RAB40C, member RAS oncogene family RAB33A 0.036 Ras-related protein Rab-33A LOC100131294 0.034 PREDICTED: similar to RAB13, member RAS oncogene fa... LOC100131294 0.034 PREDICTED: similar to hCG24991 LOC100131294 0.034 PREDICTED: similar to hCG24991 RAB30 0.034 RAB30, member RAS oncogene family RAB13 0.032 RAB13, member RAS oncogene family GEM 0.032 GTP-binding mitogen-induced T-cell protein GEM 0.032 GTP-binding mitogen-induced T-cell protein RAB40B 0.030 RAB40B, member RAS oncogene family RAB23 0.030 Ras-related protein Rab-23 RAB23 0.030 Ras-related protein Rab-23 DIRAS2 0.030 Di-Ras2 RAB19 0.028 RAB19, member RAS oncogene family RAB27B 0.028 RAB27B, member RAS oncogene family RAB25 0.026 RAB25 RAB40A 0.026 RAB40A, member RAS oncogene family RHOU 0.024 ras homolog gene family, member U REM1 0.024 RAS-like GTP-binding protein REM RAB11B 0.024 RAB11B, member RAS oncogene family RAB40AL 0.024 RAB40A, member RAS oncogene family-like RAB8B 0.024 RAB8B, member RAS oncogene family RAB27A 0.022 Ras-related protein Rab-27A RAB27A 0.022 Ras-related protein Rab-27A RAB27A 0.022 Ras-related protein Rab-27AHuman BLASTP results (used to prepare the table) | |||
Gene descriptions are from NCBI RefSeq. Search results were obtained with NCBI BLAST and RefSeq entries. When identical proteins are present, the self-match may not be listed first in BLASTP output. In such cases, the table above has been reordered to place it first.
See About the Figures for the scoring system used in the figure above right. The same scoring system was used in the table of BLASTP results.
Guide to the Human Genome
Copyright © 2010 by Stewart Scherer. All rights reserved.
