
| Name: DIRAS2 | Sequence: fasta or formatted (199aa) | NCBI GI: 21703367 | |
|
Description: Di-Ras2
|
Referenced in:
| ||
|
Composition:
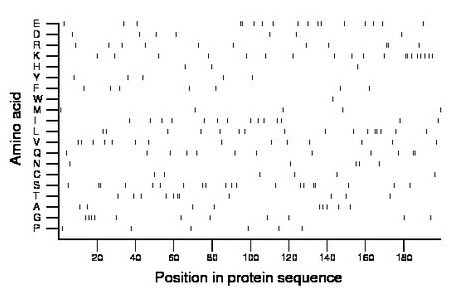
Amino acid Percentage Count Longest homopolymer A alanine 4.5 9 1 C cysteine 3.0 6 1 D aspartate 3.5 7 1 E glutamate 8.5 17 2 F phenylalanine 3.5 7 1 G glycine 5.5 11 2 H histidine 1.5 3 1 I isoleucine 7.0 14 1 K lysine 9.5 19 2 L leucine 8.0 16 2 M methionine 2.5 5 1 N asparagine 2.5 5 1 P proline 3.0 6 1 Q glutamine 6.0 12 2 R arginine 5.5 11 2 S serine 10.1 20 2 T threonine 5.5 11 2 V valine 7.0 14 1 W tryptophan 0.5 1 1 Y tyrosine 2.5 5 1 |
Comparative genomics:
Search single species RefSeq proteins at NCBI
Search summary 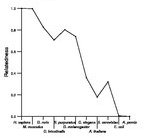
Figure data | ||
Related human proteins:Protein Relative score Description Self-match 1.000 Di-Ras2 DIRAS1 0.808 DIRAS family, GTP-binding RAS-like 1 DIRAS3 0.436 DIRAS family, GTP-binding RAS-like 3 RAP2C 0.379 RAP2C, member of RAS oncogene family RAP2A 0.371 RAP2A, member of RAS oncogene family RAP2B 0.358 RAP2B, member of RAS oncogene family RAP1A 0.355 RAP1A, member of RAS oncogene family RAP1A 0.355 RAP1A, member of RAS oncogene family RAP1B 0.352 RAP1B, member of RAS oncogene family RAP1B 0.352 RAP1B, member of RAS oncogene family KRAS 0.322 c-K-ras2 protein isoform b precursor RASD2 0.304 RASD family, member 2 KRAS 0.293 c-K-ras2 protein isoform a precursor RRAS 0.290 related RAS viral (r-ras) oncogene homolog RRAS2 0.285 related RAS viral (r-ras) oncogene homolog 2 isoform... RASD1 0.279 RAS, dexamethasone-induced 1 RIT2 0.276 Ras-like without CAAX 2 RALB 0.274 v-ral simian leukemia viral oncogene homolog B HRAS 0.271 v-Ha-ras Harvey rat sarcoma viral oncogene homolog ... HRAS 0.271 v-Ha-ras Harvey rat sarcoma viral oncogene homolog is... NRAS 0.266 neuroblastoma RAS viral (v-ras) oncogene homolog [Hom... RHEB 0.263 Ras homolog enriched in brain RIT1 0.260 Ras-like without CAAX 1 HRAS 0.255 v-Ha-ras Harvey rat sarcoma viral oncogene homolog i... RHEBL1 0.255 Ras homolog enriched in brain like 1 RALA 0.252 ras related v-ral simian leukemia viral oncogene hom... RERG 0.241 RAS-like, estrogen-regulated, growth inhibitor [Homo... MRAS 0.228 muscle RAS oncogene homolog MRAS 0.228 muscle RAS oncogene homolog GEM 0.206 GTP-binding mitogen-induced T-cell proteinHuman BLASTP results (used to prepare the table) | |||
Gene descriptions are from NCBI RefSeq. Search results were obtained with NCBI BLAST and RefSeq entries. When identical proteins are present, the self-match may not be listed first in BLASTP output. In such cases, the table above has been reordered to place it first.
See About the Figures for the scoring system used in the figure above right. The same scoring system was used in the table of BLASTP results.
Guide to the Human Genome
Copyright © 2010 by Stewart Scherer. All rights reserved.
