
| Name: LOC100134320 | Sequence: fasta or formatted (93aa) | NCBI GI: 239757778 | |
|
Description: PREDICTED: hypothetical protein
| Not currently referenced in the text | ||
|
Composition:
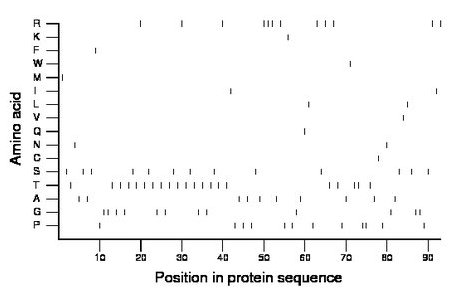
Amino acid Percentage Count Longest homopolymer A alanine 10.8 10 1 C cysteine 1.1 1 1 D aspartate 0.0 0 0 E glutamate 0.0 0 0 F phenylalanine 1.1 1 1 G glycine 12.9 12 2 H histidine 0.0 0 0 I isoleucine 2.2 2 1 K lysine 1.1 1 1 L leucine 2.2 2 1 M methionine 1.1 1 1 N asparagine 2.2 2 1 P proline 12.9 12 2 Q glutamine 1.1 1 1 R arginine 12.9 12 3 S serine 14.0 13 1 T threonine 22.6 21 2 V valine 1.1 1 1 W tryptophan 1.1 1 1 Y tyrosine 0.0 0 0 |
Comparative genomics:
Search single species RefSeq proteins at NCBI
Search summary 
Figure data | ||
Related human proteins:Protein Relative score Description Self-match 1.000 PREDICTED: hypothetical protein LOC100294420 0.120 PREDICTED: similar to mucin 2 MUC2 0.102 mucin 2 precursor MAPT 0.102 microtubule-associated protein tau isoform 6 MAPT 0.090 microtubule-associated protein tau isoform 2 MAPT 0.090 microtubule-associated protein tau isoform 4 MAPT 0.090 microtubule-associated protein tau isoform 3 MAPT 0.090 microtubule-associated protein tau isoform 1 MAPT 0.090 microtubule-associated protein tau isoform 5 FOXA3 0.084 forkhead box A3 MUC5AC 0.084 mucin 5AC MUC5B 0.084 mucin 5, subtype B, tracheobronchial LOC100131251 0.078 PREDICTED: hypothetical protein LOC100131251 0.078 PREDICTED: hypothetical protein LOC100293770 0.072 PREDICTED: hypothetical protein LOC100133756 0.072 PREDICTED: hypothetical protein, partial LOC100288201 0.072 PREDICTED: hypothetical protein LOC100288201 0.072 PREDICTED: hypothetical protein XP_002343260 LOC100134147 0.066 PREDICTED: hypothetical protein LOC100291523 0.066 PREDICTED: hypothetical protein XP_002348200 LOC100131514 0.066 PREDICTED: similar to intestinal mucin MUC3B LOC100288052 0.066 PREDICTED: hypothetical protein XP_002344236 MUC6 0.060 mucin 6, gastric LOC100292958 0.060 PREDICTED: hypothetical protein LOC100288311 0.060 PREDICTED: hypothetical protein LOC100288311 0.060 PREDICTED: hypothetical protein XP_002342972 IQSEC2 0.060 IQ motif and Sec7 domain 2 isoform1 CLASP1 0.060 CLIP-associating protein 1 isoform 2 LOC100132635 0.060 PREDICTED: similar to mucin 5, partial CIC 0.060 capicua homologHuman BLASTP results (used to prepare the table) | |||
Gene descriptions are from NCBI RefSeq. Search results were obtained with NCBI BLAST and RefSeq entries. When identical proteins are present, the self-match may not be listed first in BLASTP output. In such cases, the table above has been reordered to place it first.
See About the Figures for the scoring system used in the figure above right. The same scoring system was used in the table of BLASTP results.
Guide to the Human Genome
Copyright © 2010 by Stewart Scherer. All rights reserved.
