
| Name: LOC100291596 | Sequence: fasta or formatted (600aa) | NCBI GI: 239755920 | |
|
Description: PREDICTED: hypothetical protein XP_002344746
| Not currently referenced in the text | ||
|
Composition:
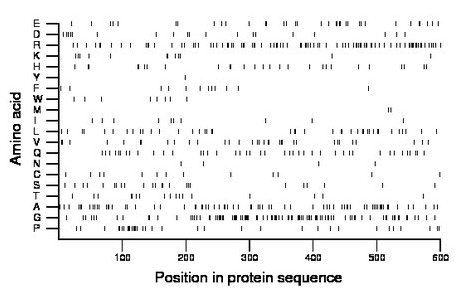
Amino acid Percentage Count Longest homopolymer A alanine 12.2 73 3 C cysteine 2.2 13 1 D aspartate 3.2 19 1 E glutamate 6.0 36 2 F phenylalanine 2.0 12 1 G glycine 15.8 95 3 H histidine 4.5 27 2 I isoleucine 1.7 10 1 K lysine 2.2 13 2 L leucine 7.2 43 2 M methionine 0.5 3 1 N asparagine 0.7 4 1 P proline 5.7 34 3 Q glutamine 7.0 42 1 R arginine 15.3 92 3 S serine 4.2 25 2 T threonine 2.8 17 1 V valine 5.5 33 2 W tryptophan 1.3 8 1 Y tyrosine 0.2 1 1 |
Comparative genomics:
Search single species RefSeq proteins at NCBI
Search summary 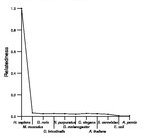
Figure data | ||
Related human proteins:Protein Relative score Description Self-match 1.000 PREDICTED: hypothetical protein XP_002344746 LOC100288068 0.745 PREDICTED: hypothetical protein XP_002343259 LOC100288068 0.614 PREDICTED: hypothetical protein LOC100292370 0.024 PREDICTED: hypothetical protein HRNR 0.022 hornerin LOC100129463 0.022 PREDICTED: hypothetical protein LOC100129463 0.022 PREDICTED: hypothetical protein LOC100129463 0.022 PREDICTED: hypothetical protein LOC100129463 0.022 PREDICTED: hypothetical protein FLG2 0.022 filaggrin family member 2 LOC100287115 0.021 PREDICTED: hypothetical protein LOC728767 0.021 PREDICTED: hypothetical protein LOC100287115 0.021 PREDICTED: hypothetical protein XP_002343389 LOC728767 0.021 PREDICTED: hypothetical protein LOC100293316 0.021 PREDICTED: hypothetical protein EWSR1 0.020 Ewing sarcoma breakpoint region 1 isoform 4 EWSR1 0.020 Ewing sarcoma breakpoint region 1 isoform 3 EWSR1 0.020 Ewing sarcoma breakpoint region 1 isoform 1 EWSR1 0.020 Ewing sarcoma breakpoint region 1 isoform 2 TAF15 0.020 TBP-associated factor 15 isoform 2 TAF15 0.020 TBP-associated factor 15 isoform 1 FAM98A 0.020 hypothetical protein LOC25940 RPGR 0.019 retinitis pigmentosa GTPase regulator isoform C [Hom... C1orf77 0.018 small protein rich in arginine and glycine PPP1R10 0.018 protein phosphatase 1, regulatory subunit 10 LOC100294413 0.018 PREDICTED: hypothetical protein FLG 0.017 filaggrin DMKN 0.017 dermokine isoform 5 precursor DMKN 0.017 dermokine isoform 3 precursor COL6A6 0.017 collagen type VI alpha 6Human BLASTP results (used to prepare the table) | |||
Gene descriptions are from NCBI RefSeq. Search results were obtained with NCBI BLAST and RefSeq entries. When identical proteins are present, the self-match may not be listed first in BLASTP output. In such cases, the table above has been reordered to place it first.
See About the Figures for the scoring system used in the figure above right. The same scoring system was used in the table of BLASTP results.
Guide to the Human Genome
Copyright © 2010 by Stewart Scherer. All rights reserved.
