
| Name: LOC100292928 | Sequence: fasta or formatted (93aa) | NCBI GI: 239755867 | |
|
Description: PREDICTED: hypothetical protein
| Not currently referenced in the text | ||
|
Composition:
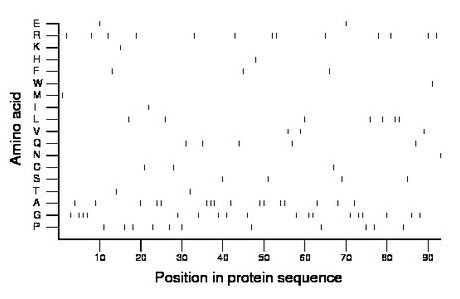
Amino acid Percentage Count Longest homopolymer A alanine 17.2 16 3 C cysteine 3.2 3 1 D aspartate 0.0 0 0 E glutamate 2.2 2 1 F phenylalanine 3.2 3 1 G glycine 19.4 18 3 H histidine 1.1 1 1 I isoleucine 1.1 1 1 K lysine 1.1 1 1 L leucine 7.5 7 2 M methionine 1.1 1 1 N asparagine 1.1 1 1 P proline 11.8 11 1 Q glutamine 5.4 5 1 R arginine 14.0 13 2 S serine 4.3 4 1 T threonine 2.2 2 1 V valine 3.2 3 1 W tryptophan 1.1 1 1 Y tyrosine 0.0 0 0 |
Comparative genomics:
Search single species RefSeq proteins at NCBI
Search summary 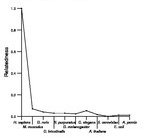
Figure data | ||
Related human proteins:Protein Relative score Description Self-match 1.000 PREDICTED: hypothetical protein LOC100289882 1.000 PREDICTED: hypothetical protein XP_002347378 LOC100289313 0.982 PREDICTED: hypothetical protein XP_002343216 LOC651986 0.070 PREDICTED: similar to forkhead box L2 LOC100288524 0.070 PREDICTED: hypothetical protein XP_002342748 LOC651986 0.070 PREDICTED: similar to forkhead box L2 LOC100129463 0.047 PREDICTED: hypothetical protein LOC100290741 0.047 PREDICTED: hypothetical protein XP_002346521 LOC100129463 0.047 PREDICTED: hypothetical protein LOC100288445 0.047 PREDICTED: hypothetical protein XP_002342359 LOC100129463 0.047 PREDICTED: hypothetical protein NACAD 0.041 NAC alpha domain containing NACAD 0.041 PREDICTED: NAC alpha domain containing NACAD 0.041 PREDICTED: NAC alpha domain containing NACAD 0.041 PREDICTED: NAC alpha domain containing NACAD 0.041 PREDICTED: NAC alpha domain containing UNCX 0.041 UNC homeobox EN1 0.041 engrailed homeobox 1 LOC389174 0.041 PREDICTED: hypothetical protein LOC389174 0.041 PREDICTED: hypothetical protein LOC389174 0.041 PREDICTED: hypothetical protein COL2A1 0.035 collagen, type II, alpha 1 isoform 1 precursor [Hom... COL2A1 0.035 collagen, type II, alpha 1 isoform 2 precursor [Hom... DVL1 0.035 dishevelled 1 LOC100292296 0.035 PREDICTED: hypothetical protein LOC100290476 0.035 PREDICTED: hypothetical protein XP_002347412 INVS 0.035 inversin isoform a INVS 0.035 inversin isoform b FIZ1 0.035 FLT3-interacting zinc finger 1 FADS1 0.035 fatty acid desaturase 1Human BLASTP results (used to prepare the table) | |||
Gene descriptions are from NCBI RefSeq. Search results were obtained with NCBI BLAST and RefSeq entries. When identical proteins are present, the self-match may not be listed first in BLASTP output. In such cases, the table above has been reordered to place it first.
See About the Figures for the scoring system used in the figure above right. The same scoring system was used in the table of BLASTP results.
Guide to the Human Genome
Copyright © 2010 by Stewart Scherer. All rights reserved.
