
| Name: DACT1 | Sequence: fasta or formatted (799aa) | NCBI GI: 118498364 | |
|
Description: dapper 1 isoform 2
|
Referenced in:
| ||
Other entries for this name:
alt prot [836aa] dapper 1 isoform 1 | |||
|
Composition:
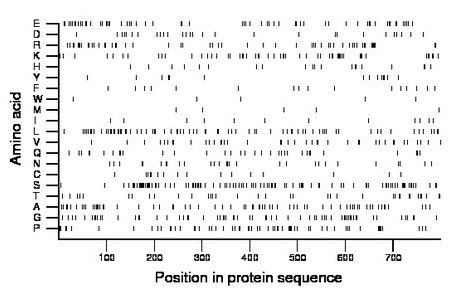
Amino acid Percentage Count Longest homopolymer A alanine 8.3 66 3 C cysteine 2.0 16 1 D aspartate 3.6 29 2 E glutamate 7.9 63 2 F phenylalanine 2.0 16 1 G glycine 8.3 66 3 H histidine 2.5 20 1 I isoleucine 1.5 12 1 K lysine 7.0 56 3 L leucine 9.5 76 3 M methionine 0.8 6 1 N asparagine 3.6 29 2 P proline 7.6 61 2 Q glutamine 4.1 33 2 R arginine 6.9 55 3 S serine 12.4 99 3 T threonine 4.6 37 3 V valine 5.0 40 2 W tryptophan 0.6 5 1 Y tyrosine 1.8 14 1 |
Comparative genomics:
Search single species RefSeq proteins at NCBI
Search summary 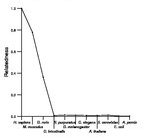
Figure data | ||
Related human proteins:Protein Relative score Description Self-match 1.000 dapper 1 isoform 2 DACT1 0.989 dapper 1 isoform 1 DACT3 0.063 thymus expressed gene 3-like DACT2 0.051 dapper, antagonist of beta-catenin, homolog 2 [Homo... SRRM2 0.018 splicing coactivator subunit SRm300 HIVEP3 0.013 human immunodeficiency virus type I enhancer bindin... HIVEP3 0.013 human immunodeficiency virus type I enhancer bindin... AFF1 0.012 myeloid/lymphoid or mixed-lineage leukemia trithorax ... PLEC1 0.011 plectin 1 isoform 11 PLEC1 0.011 plectin 1 isoform 10 PLEC1 0.011 plectin 1 isoform 8 PLEC1 0.011 plectin 1 isoform 7 PLEC1 0.011 plectin 1 isoform 6 PLEC1 0.011 plectin 1 isoform 3 PLEC1 0.011 plectin 1 isoform 2 PLEC1 0.011 plectin 1 isoform 1 TCOF1 0.011 Treacher Collins-Franceschetti syndrome 1 isoform a ... USP31 0.010 ubiquitin specific peptidase 31 MYH7B 0.010 myosin, heavy polypeptide 7B, cardiac muscle, beta ... TCOF1 0.010 Treacher Collins-Franceschetti syndrome 1 isoform e... ST5 0.010 suppression of tumorigenicity 5 isoform 1 ST5 0.010 suppression of tumorigenicity 5 isoform 1 TNK2 0.010 tyrosine kinase, non-receptor, 2 isoform 1 TNK2 0.010 tyrosine kinase, non-receptor, 2 isoform 2 MICALL1 0.010 molecule interacting with Rab13 LOC100133220 0.009 PREDICTED: hypothetical protein THRAP3 0.009 thyroid hormone receptor associated protein 3 [Homo... SRRM1 0.009 serine/arginine repetitive matrix 1 MAP7D1 0.009 MAP7 domain containing 1 BASP1 0.009 brain abundant, membrane attached signal protein 1 [...Human BLASTP results (used to prepare the table) | |||
Gene descriptions are from NCBI RefSeq. Search results were obtained with NCBI BLAST and RefSeq entries. When identical proteins are present, the self-match may not be listed first in BLASTP output. In such cases, the table above has been reordered to place it first.
See About the Figures for the scoring system used in the figure above right. The same scoring system was used in the table of BLASTP results.
Guide to the Human Genome
Copyright © 2010 by Stewart Scherer. All rights reserved.
