| Name: LOC100286989 | Sequence: fasta or formatted (119aa) | NCBI GI: 239741366 | |
|
Description: PREDICTED: hypothetical protein XP_002342186
| Not currently referenced in the text | ||
|
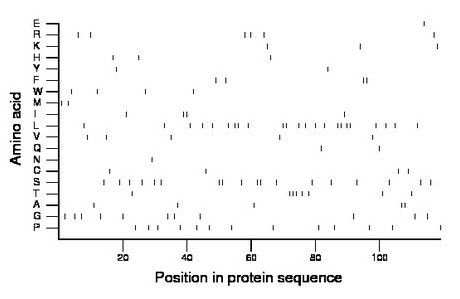
Composition:

Amino acid Percentage Count Longest homopolymer A alanine 4.2 5 2 C cysteine 3.4 4 1 D aspartate 0.0 0 0 E glutamate 0.8 1 1 F phenylalanine 3.4 4 2 G glycine 9.2 11 1 H histidine 2.5 3 1 I isoleucine 3.4 4 2 K lysine 2.5 3 1 L leucine 19.3 23 2 M methionine 1.7 2 1 N asparagine 0.8 1 1 P proline 10.9 13 1 Q glutamine 1.7 2 1 R arginine 5.0 6 1 S serine 15.1 18 2 T threonine 6.7 8 3 V valine 4.2 5 1 W tryptophan 3.4 4 1 Y tyrosine 1.7 2 1 |
Comparative genomics:
Search single species RefSeq proteins at NCBI
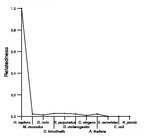
Search summary 
Figure data | ||
Related human proteins:Protein Relative score Description Self-match 1.000 PREDICTED: hypothetical protein XP_002342186 LOC100293276 1.000 PREDICTED: similar to hCG1995379 LOC100291463 1.000 PREDICTED: hypothetical protein XP_002347548 C8orf86 0.031 hypothetical protein LOC389649 CSPG4 0.027 chondroitin sulfate proteoglycan 4 LOC100128895 0.022 PREDICTED: hypothetical protein LOC100128895 0.022 PREDICTED: hypothetical protein LOC100128895 0.022 PREDICTED: hypothetical protein DKFZp761E198 0.013 hypothetical protein LOC91056 LOC100287907 0.013 PREDICTED: hypothetical protein LOC100287907 0.013 PREDICTED: hypothetical protein XP_002343168 ASB14 0.013 ankyrin repeat and SOCS box-containing 14 isoform 1... ASB14 0.013 ankyrin repeat and SOCS box-containing 14 isoform 2 ... LOC100134663 0.009 PREDICTED: hypothetical protein, partial ALPK1 0.009 alpha-kinase 1 ALPK1 0.009 alpha-kinase 1 TMC4 0.004 transmembrane channel-like 4 isoform 2 TMC4 0.004 transmembrane channel-like 4 isoform 1 USP33 0.004 ubiquitin specific protease 33 isoform 3 USP33 0.004 ubiquitin specific protease 33 isoform 1 USP33 0.004 ubiquitin specific protease 33 isoform 2 FLJ43860 0.004 hypothetical protein LOC389690Human BLASTP results (used to prepare the table) | |||
Gene descriptions are from NCBI RefSeq. Search results were obtained with NCBI BLAST and RefSeq entries. When identical proteins are present, the self-match may not be listed first in BLASTP output. In such cases, the table above has been reordered to place it first.
See About the Figures for the scoring system used in the figure above right. The same scoring system was used in the table of BLASTP results.
Guide to the Human Genome
Copyright © 2010 by Stewart Scherer. All rights reserved.
