
| Name: QSER1 | Sequence: fasta or formatted (1735aa) | NCBI GI: 115647981 | |
|
Description: glutamine and serine rich 1
| Not currently referenced in the text | ||
|
Composition:
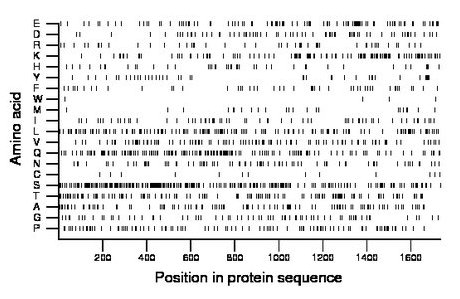
Amino acid Percentage Count Longest homopolymer A alanine 5.8 100 3 C cysteine 0.7 13 1 D aspartate 4.2 73 2 E glutamate 5.9 103 3 F phenylalanine 2.8 49 1 G glycine 4.3 75 2 H histidine 2.6 45 2 I isoleucine 3.6 63 2 K lysine 6.8 118 4 L leucine 8.4 146 3 M methionine 1.4 24 1 N asparagine 4.7 81 3 P proline 6.2 108 3 Q glutamine 8.9 154 3 R arginine 2.8 49 2 S serine 14.7 255 4 T threonine 7.8 135 4 V valine 5.7 99 2 W tryptophan 0.2 4 1 Y tyrosine 2.4 41 1 |
Comparative genomics:
Search single species RefSeq proteins at NCBI
Search summary 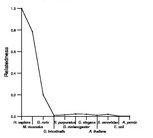
Figure data | ||
Related human proteins:Protein Relative score Description Self-match 1.000 glutamine and serine rich 1 PRR12 0.063 proline rich 12 LOC100134138 0.015 PREDICTED: similar to mucin, partial LOC100133408 0.014 PREDICTED: similar to mucin MUC3A 0.012 PREDICTED: mucin 3A, cell surface associated, parti... MUC6 0.012 mucin 6, gastric MUC4 0.011 mucin 4 isoform a LOC100131514 0.011 PREDICTED: similar to hCG1747327, partial MUC17 0.010 mucin 17 MUC12 0.010 PREDICTED: mucin 12 MUC21 0.010 mucin 21 MUC16 0.010 mucin 16 MUC12 0.010 PREDICTED: mucin 12, cell surface associated HEG1 0.010 HEG homolog 1 MUC3B 0.009 PREDICTED: mucin 3B, cell surface associated, parti... MUC3A 0.009 PREDICTED: mucin 3A, intestinal NFAT5 0.009 nuclear factor of activated T-cells 5 isoform a [Hom... NFAT5 0.009 nuclear factor of activated T-cells 5 isoform c [Homo... NFAT5 0.009 nuclear factor of activated T-cells 5 isoform d [Ho... NFAT5 0.009 nuclear factor of activated T-cells 5 isoform b [Ho... NFAT5 0.009 nuclear factor of activated T-cells 5 isoform a [Hom... MUC12 0.008 PREDICTED: mucin 12 POLR2A 0.008 DNA-directed RNA polymerase II A BPTF 0.008 bromodomain PHD finger transcription factor isoform ... LOC100133790 0.008 PREDICTED: intestinal mucin-like, partial BAT2D1 0.007 HBxAg transactivated protein 2 MUC12 0.007 PREDICTED: mucin 12 RTF1 0.007 Paf1/RNA polymerase II complex component NEFH 0.007 neurofilament, heavy polypeptide 200kDa UBAP2L 0.007 ubiquitin associated protein 2-like isoform a [Homo...Human BLASTP results (used to prepare the table) | |||
Gene descriptions are from NCBI RefSeq. Search results were obtained with NCBI BLAST and RefSeq entries. When identical proteins are present, the self-match may not be listed first in BLASTP output. In such cases, the table above has been reordered to place it first.
See About the Figures for the scoring system used in the figure above right. The same scoring system was used in the table of BLASTP results.
Guide to the Human Genome
Copyright © 2010 by Stewart Scherer. All rights reserved.
