
| Name: CUX1 | Sequence: fasta or formatted (1505aa) | NCBI GI: 148277064 | |
|
Description: cut-like homeobox 1 isoform a
|
Referenced in: Homeobox and Related Proteins
| ||
Other entries for this name:
alt prot [678aa] cut-like homeobox 1 isoform b alt prot [676aa] cut-like homeobox 1 isoform c | |||
|
Composition:
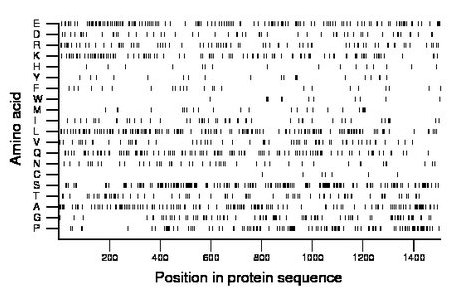
Amino acid Percentage Count Longest homopolymer A alanine 9.2 139 4 C cysteine 0.5 8 1 D aspartate 3.8 57 3 E glutamate 9.8 147 2 F phenylalanine 1.7 25 2 G glycine 5.7 86 3 H histidine 1.1 16 1 I isoleucine 3.3 50 2 K lysine 6.7 101 3 L leucine 9.4 141 3 M methionine 1.6 24 1 N asparagine 3.2 48 2 P proline 8.3 125 3 Q glutamine 7.7 116 3 R arginine 5.6 84 2 S serine 11.8 177 5 T threonine 4.7 70 2 V valine 3.9 59 2 W tryptophan 0.8 12 2 Y tyrosine 1.3 20 1 |
Comparative genomics:
Search single species RefSeq proteins at NCBI
Search summary 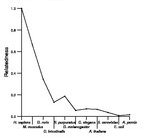
Figure data | ||
Related human proteins:Protein Relative score Description Self-match 1.000 cut-like homeobox 1 isoform a CUX2 0.352 cut-like 2 CUX1 0.248 cut-like homeobox 1 isoform b CUX1 0.245 cut-like homeobox 1 isoform c PLEC1 0.021 plectin 1 isoform 11 PLEC1 0.021 plectin 1 isoform 10 PLEC1 0.021 plectin 1 isoform 8 PLEC1 0.021 plectin 1 isoform 7 PLEC1 0.021 plectin 1 isoform 6 PLEC1 0.021 plectin 1 isoform 3 PLEC1 0.021 plectin 1 isoform 2 PLEC1 0.021 plectin 1 isoform 1 MYH13 0.020 myosin, heavy polypeptide 13, skeletal muscle [Homo... DCTN1 0.019 dynactin 1 isoform 4 DCTN1 0.019 dynactin 1 isoform 3 DCTN1 0.019 dynactin 1 isoform 2 DCTN1 0.019 dynactin 1 isoform 1 ONECUT3 0.019 one cut homeobox 3 ONECUT1 0.018 one cut homeobox 1 CEP250 0.018 centrosomal protein 2 GOLGA4 0.018 golgi autoantigen, golgin subfamily a, 4 MYH4 0.018 myosin, heavy polypeptide 4, skeletal muscle MYH10 0.018 myosin, heavy polypeptide 10, non-muscle DST 0.017 dystonin isoform 1e precursor CLIP1 0.017 restin isoform a TPM1 0.017 tropomyosin 1 alpha chain isoform 3 MYH3 0.017 myosin, heavy chain 3, skeletal muscle, embryonic [H... TPM1 0.016 tropomyosin 1 alpha chain isoform 4 CEP110 0.016 centrosomal protein 110kDa EEA1 0.016 early endosome antigen 1, 162kDHuman BLASTP results (used to prepare the table) | |||
Gene descriptions are from NCBI RefSeq. Search results were obtained with NCBI BLAST and RefSeq entries. When identical proteins are present, the self-match may not be listed first in BLASTP output. In such cases, the table above has been reordered to place it first.
See About the Figures for the scoring system used in the figure above right. The same scoring system was used in the table of BLASTP results.
Guide to the Human Genome
Copyright © 2010 by Stewart Scherer. All rights reserved.
