
| Name: CUX1 | Sequence: fasta or formatted (676aa) | NCBI GI: 31652238 | |
|
Description: cut-like homeobox 1 isoform c
|
Referenced in: Homeobox and Related Proteins
| ||
Other entries for this name:
alt prot [1505aa] cut-like homeobox 1 isoform a alt prot [678aa] cut-like homeobox 1 isoform b | |||
|
Composition:
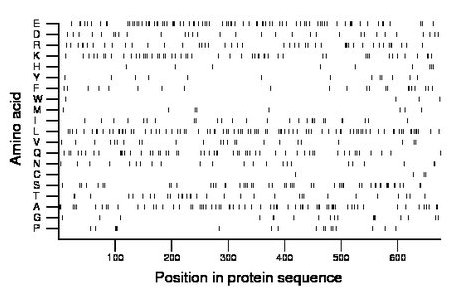
Amino acid Percentage Count Longest homopolymer A alanine 10.2 69 3 C cysteine 0.6 4 1 D aspartate 4.7 32 2 E glutamate 12.1 82 2 F phenylalanine 3.3 22 2 G glycine 2.7 18 1 H histidine 1.3 9 1 I isoleucine 4.0 27 2 K lysine 7.7 52 2 L leucine 12.7 86 3 M methionine 1.3 9 1 N asparagine 3.4 23 1 P proline 2.5 17 1 Q glutamine 8.1 55 2 R arginine 6.7 45 1 S serine 7.7 52 2 T threonine 4.9 33 2 V valine 3.6 24 1 W tryptophan 0.6 4 1 Y tyrosine 1.9 13 1 |
Comparative genomics:
Search single species RefSeq proteins at NCBI
Search summary 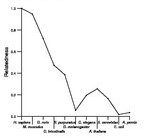
Figure data | ||
Related human proteins:Protein Relative score Description Self-match 1.000 cut-like homeobox 1 isoform c CUX1 0.996 cut-like homeobox 1 isoform b CUX1 0.563 cut-like homeobox 1 isoform a CUX2 0.255 cut-like 2 MYH13 0.052 myosin, heavy polypeptide 13, skeletal muscle [Homo... MYH10 0.051 myosin, heavy polypeptide 10, non-muscle PLEC1 0.049 plectin 1 isoform 11 PLEC1 0.049 plectin 1 isoform 10 PLEC1 0.049 plectin 1 isoform 8 PLEC1 0.049 plectin 1 isoform 7 PLEC1 0.049 plectin 1 isoform 6 PLEC1 0.049 plectin 1 isoform 3 PLEC1 0.049 plectin 1 isoform 2 PLEC1 0.049 plectin 1 isoform 1 AKAP9 0.048 A-kinase anchor protein 9 isoform 2 MYH11 0.048 smooth muscle myosin heavy chain 11 isoform SM1A [Ho... MYH11 0.048 smooth muscle myosin heavy chain 11 isoform SM1B [Ho... MYH11 0.048 smooth muscle myosin heavy chain 11 isoform SM2B [Ho... MYH11 0.048 smooth muscle myosin heavy chain 11 isoform SM2A [Ho... ERC1 0.047 RAB6-interacting protein 2 isoform epsilon CLIP1 0.047 restin isoform a ERC1 0.047 RAB6-interacting protein 2 isoform delta DCTN1 0.046 dynactin 1 isoform 4 DCTN1 0.046 dynactin 1 isoform 3 DCTN1 0.046 dynactin 1 isoform 2 DCTN1 0.046 dynactin 1 isoform 1 EEA1 0.045 early endosome antigen 1, 162kD CGNL1 0.045 cingulin-like 1 MYH3 0.044 myosin, heavy chain 3, skeletal muscle, embryonic [H... CLIP1 0.043 restin isoform bHuman BLASTP results (used to prepare the table) | |||
Gene descriptions are from NCBI RefSeq. Search results were obtained with NCBI BLAST and RefSeq entries. When identical proteins are present, the self-match may not be listed first in BLASTP output. In such cases, the table above has been reordered to place it first.
See About the Figures for the scoring system used in the figure above right. The same scoring system was used in the table of BLASTP results.
Guide to the Human Genome
Copyright © 2010 by Stewart Scherer. All rights reserved.
