
| Name: TBR1 | Sequence: fasta or formatted (682aa) | NCBI GI: 5730081 | |
|
Description: T-box, brain, 1
|
Referenced in: Additional Brain Proteins
| ||
|
Composition:
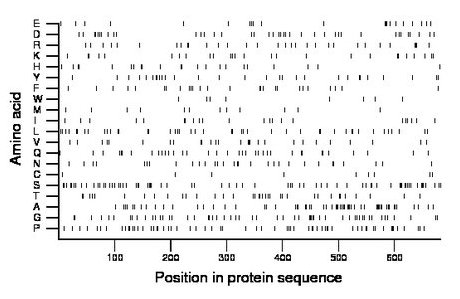
Amino acid Percentage Count Longest homopolymer A alanine 9.2 63 5 C cysteine 1.3 9 1 D aspartate 5.7 39 1 E glutamate 3.1 21 2 F phenylalanine 3.8 26 1 G glycine 8.1 55 2 H histidine 3.2 22 2 I isoleucine 3.4 23 2 K lysine 4.0 27 2 L leucine 6.6 45 2 M methionine 1.9 13 1 N asparagine 4.7 32 3 P proline 9.1 62 2 Q glutamine 5.4 37 2 R arginine 4.5 31 3 S serine 11.0 75 3 T threonine 5.3 36 2 V valine 4.1 28 2 W tryptophan 1.2 8 1 Y tyrosine 4.4 30 2 |
Comparative genomics:
Search single species RefSeq proteins at NCBI
Search summary 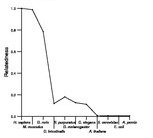
Figure data | ||
Related human proteins:Protein Relative score Description Self-match 1.000 T-box, brain, 1 EOMES 0.357 eomesodermin TBX21 0.218 T-box 21 TBX5 0.124 T-box 5 isoform 2 TBX5 0.124 T-box 5 isoform 1 TBX5 0.124 T-box 5 isoform 1 TBX5 0.123 T-box 5 isoform 3 TBX19 0.122 T-box 19 T 0.120 transcription factor T TBX4 0.119 T-box 4 TBX6 0.117 T-box 6 MGA 0.117 MAX gene associated TBX3 0.117 T-box 3 protein isoform 1 TBX2 0.115 T-box 2 TBX3 0.112 T-box 3 protein isoform 2 TBX18 0.112 T-box 18 TBX15 0.109 T-box 15 TBX10 0.109 T-box 10 TBX1 0.109 T-box 1 isoform B TBX1 0.107 T-box 1 isoform C TBX1 0.107 T-box 1 isoform A TBX22 0.106 T-box 22 isoform 1 TBX22 0.106 T-box 22 isoform 1 TBX20 0.104 T-box transcription factor TBX20 TBX22 0.086 T-box 22 isoform 2 AATK 0.010 apoptosis-associated tyrosine kinase SOX30 0.009 SRY (sex determining region Y)-box 30 isoform a [Hom... ATXN2L 0.009 ataxin 2 related protein isoform B ATXN2L 0.009 ataxin 2 related protein isoform E ATXN2L 0.009 ataxin 2 related protein isoform CHuman BLASTP results (used to prepare the table) | |||
Gene descriptions are from NCBI RefSeq. Search results were obtained with NCBI BLAST and RefSeq entries. When identical proteins are present, the self-match may not be listed first in BLASTP output. In such cases, the table above has been reordered to place it first.
See About the Figures for the scoring system used in the figure above right. The same scoring system was used in the table of BLASTP results.
Guide to the Human Genome
Copyright © 2010 by Stewart Scherer. All rights reserved.
