
| Name: GPR148 | Sequence: fasta or formatted (347aa) | NCBI GI: 46409360 | |
|
Description: G protein-coupled receptor 148
|
Referenced in:
| ||
|
Composition:
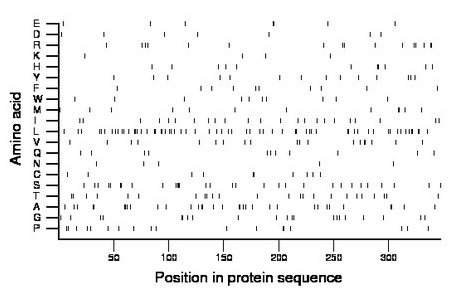
Amino acid Percentage Count Longest homopolymer A alanine 9.5 33 3 C cysteine 2.9 10 2 D aspartate 2.0 7 1 E glutamate 2.0 7 2 F phenylalanine 2.9 10 1 G glycine 6.1 21 2 H histidine 3.2 11 2 I isoleucine 6.6 23 1 K lysine 1.2 4 1 L leucine 17.9 62 3 M methionine 3.5 12 2 N asparagine 1.4 5 1 P proline 5.2 18 2 Q glutamine 3.2 11 1 R arginine 4.6 16 2 S serine 8.6 30 4 T threonine 6.9 24 2 V valine 5.5 19 2 W tryptophan 2.9 10 1 Y tyrosine 4.0 14 1 |
Comparative genomics:
Search single species RefSeq proteins at NCBI
Search summary 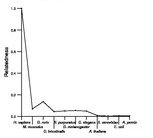
Figure data | ||
Related human proteins:Protein Relative score Description Self-match 1.000 G protein-coupled receptor 148 HTR1B 0.070 5-hydroxytryptamine (serotonin) receptor 1B HTR1D 0.064 5-hydroxytryptamine (serotonin) receptor 1D HTR5A 0.058 5-hydroxytryptamine receptor 5A ADRA1D 0.055 alpha-1D-adrenergic receptor ADRB3 0.052 adrenergic, beta-3-, receptor CHRM1 0.050 cholinergic receptor, muscarinic 1 ADRA1B 0.047 alpha-1B-adrenergic receptor HTR6 0.044 5-hydroxytryptamine (serotonin) receptor 6 HTR1A 0.044 5-hydroxytryptamine (serotonin) receptor 1A SSTR5 0.041 somatostatin receptor 5 ADRB1 0.041 beta-1-adrenergic receptor ADRA1A 0.040 alpha-1A-adrenergic receptor isoform 4 ADRA1A 0.040 alpha-1A-adrenergic receptor isoform 1 ADRA1A 0.040 alpha-1A-adrenergic receptor isoform 2 ADRA1A 0.040 alpha-1A-adrenergic receptor isoform 3 HTR1F 0.040 5-hydroxytryptamine (serotonin) receptor 1F NPY1R 0.040 neuropeptide Y receptor Y1 GPR101 0.040 G protein-coupled receptor 101 CHRM3 0.040 cholinergic receptor, muscarinic 3 HTR7 0.038 5-hydroxytryptamine receptor 7 isoform b HTR7 0.038 5-hydroxytryptamine receptor 7 isoform d HTR7 0.038 5-hydroxytryptamine receptor 7 isoform a HTR2C 0.037 5-hydroxytryptamine (serotonin) receptor 2C GPR61 0.036 G protein-coupled receptor 61 P2RY6 0.036 pyrimidinergic receptor P2Y6 P2RY6 0.036 pyrimidinergic receptor P2Y6 P2RY6 0.036 pyrimidinergic receptor P2Y6 P2RY6 0.036 pyrimidinergic receptor P2Y6 OPN4 0.036 opsin 4 isoform 1Human BLASTP results (used to prepare the table) | |||
Gene descriptions are from NCBI RefSeq. Search results were obtained with NCBI BLAST and RefSeq entries. When identical proteins are present, the self-match may not be listed first in BLASTP output. In such cases, the table above has been reordered to place it first.
See About the Figures for the scoring system used in the figure above right. The same scoring system was used in the table of BLASTP results.
Guide to the Human Genome
Copyright © 2010 by Stewart Scherer. All rights reserved.
