
| Name: CTXN1 | Sequence: fasta or formatted (82aa) | NCBI GI: 45592954 | |
|
Description: cortexin 1
|
Referenced in:
| ||
|
Composition:
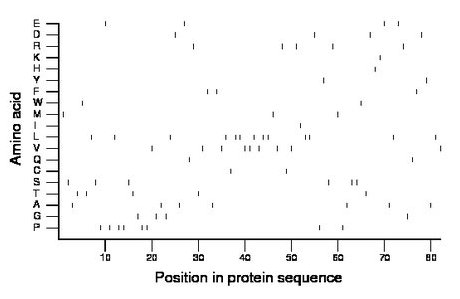
Amino acid Percentage Count Longest homopolymer A alanine 8.5 7 1 C cysteine 2.4 2 1 D aspartate 4.9 4 1 E glutamate 4.9 4 1 F phenylalanine 3.7 3 1 G glycine 4.9 4 1 H histidine 1.2 1 1 I isoleucine 1.2 1 1 K lysine 1.2 1 1 L leucine 15.9 13 2 M methionine 3.7 3 1 N asparagine 0.0 0 0 P proline 9.8 8 2 Q glutamine 2.4 2 1 R arginine 6.1 5 1 S serine 7.3 6 2 T threonine 6.1 5 1 V valine 11.0 9 2 W tryptophan 2.4 2 1 Y tyrosine 2.4 2 1 |
Comparative genomics:
Search single species RefSeq proteins at NCBI
Search summary 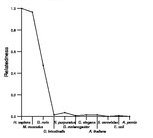
Figure data | ||
Related human proteins:Protein Relative score Description Self-match 1.000 cortexin 1 CTXN3 0.347 cortexin 3 CTXN3 0.347 cortexin 3 CTXN2 0.306 cortexin 2 LOC100293652 0.035 PREDICTED: hypothetical protein LOC100291016 0.035 PREDICTED: hypothetical protein XP_002347804 LOC100287809 0.035 PREDICTED: hypothetical protein XP_002343597 DSG2 0.021 desmoglein 2 preproprotein RYR3 0.021 ryanodine receptor 3 OPN1SW 0.021 opsin 1 (cone pigments), short-wave-sensitive LOC440829 0.014 PREDICTED: transmembrane protein 46-like LOC440829 0.014 PREDICTED: transmembrane protein 46-like LOC100287171 0.014 PREDICTED: hypothetical protein XP_002342940 isofor... LOC100287171 0.014 PREDICTED: hypothetical protein XP_002342939 isofor... WASH1 0.014 WAS protein family homolog 1 SEZ6L2 0.007 seizure related 6 homolog (mouse)-like 2 isoform 2 ... EFNA4 0.007 ephrin A4 isoform a LOC729537 0.007 PREDICTED: hypothetical protein LOC729537 0.007 PREDICTED: hypothetical protein LMTK2 0.007 lemur tyrosine kinase 2 PTPRA 0.007 protein tyrosine phosphatase, receptor type, A isofo... PTPRA 0.007 protein tyrosine phosphatase, receptor type, A isofo... SEMA4G 0.007 semaphorin 4G HEG1 0.007 HEG homolog 1 CD207 0.007 CD207 antigen, langerin ZBTB10 0.007 zinc finger and BTB domain containing 10 isoform b ... ZBTB10 0.007 zinc finger and BTB domain containing 10 isoform a ...Human BLASTP results (used to prepare the table) | |||
Gene descriptions are from NCBI RefSeq. Search results were obtained with NCBI BLAST and RefSeq entries. When identical proteins are present, the self-match may not be listed first in BLASTP output. In such cases, the table above has been reordered to place it first.
See About the Figures for the scoring system used in the figure above right. The same scoring system was used in the table of BLASTP results.
Guide to the Human Genome
Copyright © 2010 by Stewart Scherer. All rights reserved.
