
| Name: TBCC | Sequence: fasta or formatted (346aa) | NCBI GI: 4507373 | |
|
Description: beta-tubulin cofactor C
|
Referenced in: Crystallins and Other Eye Proteins
| ||
|
Composition:
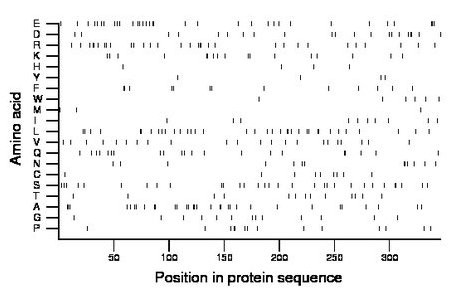
Amino acid Percentage Count Longest homopolymer A alanine 9.2 32 3 C cysteine 2.6 9 1 D aspartate 6.1 21 2 E glutamate 9.5 33 3 F phenylalanine 3.8 13 2 G glycine 3.8 13 1 H histidine 1.2 4 1 I isoleucine 2.9 10 1 K lysine 4.9 17 2 L leucine 10.4 36 2 M methionine 0.9 3 1 N asparagine 3.8 13 2 P proline 4.0 14 2 Q glutamine 6.1 21 2 R arginine 9.0 31 3 S serine 9.0 31 2 T threonine 3.8 13 1 V valine 6.4 22 1 W tryptophan 1.7 6 1 Y tyrosine 1.2 4 1 |
Comparative genomics:
Search single species RefSeq proteins at NCBI
Search summary 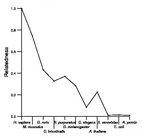
Figure data | ||
Related human proteins:Protein Relative score Description Self-match 1.000 beta-tubulin cofactor C RP2 0.119 XRP2 protein TBCCD1 0.032 TBCC domain containing 1 TBCCD1 0.032 TBCC domain containing 1 TNIK 0.024 TRAF2 and NCK interacting kinase isoform 4 TNIK 0.024 TRAF2 and NCK interacting kinase isoform 3 ENAH 0.023 enabled homolog isoform a ENAH 0.023 enabled homolog isoform b LOC100287500 0.023 PREDICTED: hypothetical protein XP_002343900 LOC100287466 0.023 PREDICTED: hypothetical protein XP_002343899 LOC100287428 0.023 PREDICTED: hypothetical protein XP_002343898 PNMA6A 0.023 paraneoplastic antigen like 6A GOLGA3 0.021 Golgi autoantigen, golgin subfamily a, 3 TCHH 0.021 trichohyalin INCENP 0.021 inner centromere protein antigens 135/155kDa isofor... INCENP 0.021 inner centromere protein antigens 135/155kDa isofor... SMTN 0.021 smoothelin isoform b SMTN 0.021 smoothelin isoform c SMTN 0.021 smoothelin isoform a TNIK 0.020 TRAF2 and NCK interacting kinase isoform 6 TNIK 0.020 TRAF2 and NCK interacting kinase isoform 5 TNIK 0.020 TRAF2 and NCK interacting kinase isoform 2 TNIK 0.020 TRAF2 and NCK interacting kinase isoform 1 BAT2D1 0.020 HBxAg transactivated protein 2 KRT32 0.018 keratin 32 KIAA0182 0.018 genetic suppressor element 1 isoform 2 KIAA0182 0.018 genetic suppressor element 1 isoform 1 GIGYF2 0.018 GRB10 interacting GYF protein 2 isoform c GIGYF2 0.018 GRB10 interacting GYF protein 2 isoform a GIGYF2 0.018 GRB10 interacting GYF protein 2 isoform bHuman BLASTP results (used to prepare the table) | |||
Gene descriptions are from NCBI RefSeq. Search results were obtained with NCBI BLAST and RefSeq entries. When identical proteins are present, the self-match may not be listed first in BLASTP output. In such cases, the table above has been reordered to place it first.
See About the Figures for the scoring system used in the figure above right. The same scoring system was used in the table of BLASTP results.
Guide to the Human Genome
Copyright © 2010 by Stewart Scherer. All rights reserved.
