
| Name: CDC6 | Sequence: fasta or formatted (560aa) | NCBI GI: 4502703 | |
|
Description: cell division cycle 6 protein
|
Referenced in: Additional Cell Cycle Functions
| ||
|
Composition:
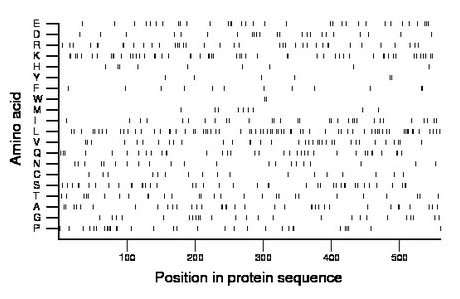
Amino acid Percentage Count Longest homopolymer A alanine 6.4 36 2 C cysteine 3.0 17 1 D aspartate 4.3 24 2 E glutamate 6.1 34 2 F phenylalanine 2.1 12 2 G glycine 4.5 25 1 H histidine 1.6 9 1 I isoleucine 5.5 31 1 K lysine 9.5 53 2 L leucine 12.5 70 2 M methionine 2.0 11 2 N asparagine 3.8 21 1 P proline 5.7 32 2 Q glutamine 6.2 35 2 R arginine 6.8 38 2 S serine 7.3 41 2 T threonine 5.0 28 2 V valine 6.2 35 1 W tryptophan 0.4 2 1 Y tyrosine 1.1 6 1 |
Comparative genomics:
Search single species RefSeq proteins at NCBI
Search summary 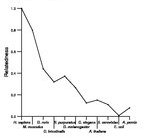
Figure data | ||
Related human proteins:Protein Relative score Description Self-match 1.000 cell division cycle 6 protein ORC1L 0.135 origin recognition complex, subunit 1 BAT2D1 0.016 HBxAg transactivated protein 2 RFC5 0.011 replication factor C 5 isoform 2 RFC5 0.011 replication factor C 5 isoform 2 RFC5 0.011 replication factor C 5 isoform 1 RFC2 0.011 replication factor C 2 isoform 1 ORC4L 0.011 origin recognition complex subunit 4 ORC4L 0.011 origin recognition complex subunit 4 ORC4L 0.011 origin recognition complex subunit 4 NWD1 0.010 NACHT and WD repeat domain containing 1 CAP2 0.009 adenylyl cyclase-associated protein 2 RFC1 0.006 replication factor C large subunit KIF3B 0.006 kinesin family member 3B BAG3 0.006 BCL2-associated athanogene 3 RFC4 0.006 replication factor C 4 RFC4 0.006 replication factor C 4 NLRP8 0.006 NLR family, pyrin domain containing 8 ATAD3B 0.006 AAA-ATPase TOB3 CCDC40 0.006 coiled-coil domain containing 40 BPTF 0.006 bromodomain PHD finger transcription factor isoform ... KSR2 0.006 kinase suppressor of ras 2 RAD17 0.006 RAD17 homolog isoform 1 RAD17 0.006 RAD17 homolog isoform 1 RAD17 0.006 RAD17 homolog isoform 1 RAD17 0.006 RAD17 homolog isoform 1 RAD17 0.006 RAD17 homolog isoform 1 RAD17 0.006 RAD17 homolog isoform 2 FCRL6 0.006 Fc receptor-like 6 FAM164A 0.006 hypothetical protein LOC51101Human BLASTP results (used to prepare the table) | |||
Gene descriptions are from NCBI RefSeq. Search results were obtained with NCBI BLAST and RefSeq entries. When identical proteins are present, the self-match may not be listed first in BLASTP output. In such cases, the table above has been reordered to place it first.
See About the Figures for the scoring system used in the figure above right. The same scoring system was used in the table of BLASTP results.
Guide to the Human Genome
Copyright © 2010 by Stewart Scherer. All rights reserved.
