
| Name: KSR2 | Sequence: fasta or formatted (921aa) | NCBI GI: 167621456 | |
|
Description: kinase suppressor of ras 2
|
Referenced in:
| ||
|
Composition:
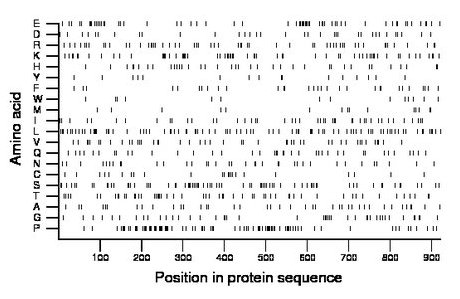
Amino acid Percentage Count Longest homopolymer A alanine 4.3 40 1 C cysteine 2.5 23 1 D aspartate 3.8 35 2 E glutamate 6.7 62 2 F phenylalanine 3.4 31 2 G glycine 4.8 44 2 H histidine 4.0 37 1 I isoleucine 5.2 48 2 K lysine 6.8 63 3 L leucine 9.3 86 2 M methionine 1.7 16 1 N asparagine 4.0 37 2 P proline 9.9 91 4 Q glutamine 4.3 40 2 R arginine 6.2 57 2 S serine 8.3 76 3 T threonine 6.1 56 2 V valine 5.2 48 2 W tryptophan 1.5 14 1 Y tyrosine 1.8 17 2 |
Comparative genomics:
Search single species RefSeq proteins at NCBI
Search summary 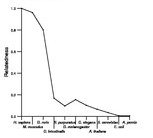
Figure data | ||
Related human proteins:Protein Relative score Description Self-match 1.000 kinase suppressor of ras 2 KSR1 0.332 kinase suppressor of ras BRAF 0.094 B-Raf RAF1 0.082 v-raf-1 murine leukemia viral oncogene homolog 1 [Hom... ARAF 0.081 v-raf murine sarcoma 3611 viral oncogene homolog [Hom... TNNI3K 0.047 TNNI3 interacting kinase isoform b TNNI3K 0.047 TNNI3 interacting kinase isoform a MAP3K12 0.044 mitogen-activated protein kinase kinase kinase 12 [H... KIAA1804 0.044 mixed lineage kinase 4 MAP3K9 0.044 mitogen-activated protein kinase kinase kinase 9 [Ho... MAP3K10 0.044 mitogen-activated protein kinase kinase kinase 10 [H... MAP3K13 0.041 mitogen-activated protein kinase kinase kinase 13 [Ho... MAP3K7 0.041 mitogen-activated protein kinase kinase kinase 7 iso... MAP3K7 0.041 mitogen-activated protein kinase kinase kinase 7 iso... MAP3K7 0.041 mitogen-activated protein kinase kinase kinase 7 iso... MAP3K7 0.041 mitogen-activated protein kinase kinase kinase 7 isof... ZAK 0.040 MLK-related kinase isoform 2 ZAK 0.040 MLK-related kinase isoform 1 MAP3K11 0.039 mitogen-activated protein kinase kinase kinase 11 [Ho... FER 0.038 fer (fps/fes related) tyrosine kinase FRK 0.037 fyn-related kinase CSK 0.036 c-src tyrosine kinase CSK 0.036 c-src tyrosine kinase PTK6 0.036 PTK6 protein tyrosine kinase 6 FES 0.035 feline sarcoma oncogene isoform 4 FES 0.035 feline sarcoma oncogene isoform 3 FES 0.035 feline sarcoma oncogene isoform 2 FES 0.035 feline sarcoma oncogene isoform 1 BTK 0.035 Bruton agammaglobulinemia tyrosine kinase NPR1 0.035 natriuretic peptide receptor 1Human BLASTP results (used to prepare the table) | |||
Gene descriptions are from NCBI RefSeq. Search results were obtained with NCBI BLAST and RefSeq entries. When identical proteins are present, the self-match may not be listed first in BLASTP output. In such cases, the table above has been reordered to place it first.
See About the Figures for the scoring system used in the figure above right. The same scoring system was used in the table of BLASTP results.
Guide to the Human Genome
Copyright © 2010 by Stewart Scherer. All rights reserved.
