| Name: RP9 | Sequence: fasta or formatted (221aa) | NCBI GI: 42718020 | |
|
Description: retinitis pigmentosa 9
|
Referenced in:
| ||
|
Composition:

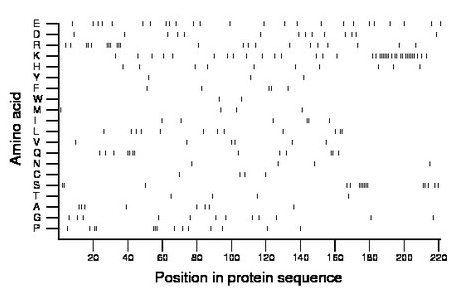
Amino acid Percentage Count Longest homopolymer A alanine 3.6 8 2 C cysteine 1.8 4 1 D aspartate 6.3 14 1 E glutamate 11.3 25 1 F phenylalanine 2.3 5 2 G glycine 5.4 12 1 H histidine 4.5 10 1 I isoleucine 2.7 6 2 K lysine 16.7 37 6 L leucine 5.4 12 2 M methionine 1.8 4 1 N asparagine 1.8 4 1 P proline 6.3 14 3 Q glutamine 5.9 13 2 R arginine 10.0 22 3 S serine 7.2 16 6 T threonine 1.8 4 1 V valine 2.7 6 1 W tryptophan 0.9 2 1 Y tyrosine 1.4 3 1 |
Comparative genomics:
Search single species RefSeq proteins at NCBI
Search summary 
Figure data | ||
Related human proteins:Protein Relative score Description Self-match 1.000 retinitis pigmentosa 9 CIR1 0.085 CBF1 interacting corepressor NKAP 0.078 NFKB activating protein CWF19L2 0.074 CWF19-like 2, cell cycle control PPIG 0.067 peptidylprolyl isomerase G SFRS12IP1 0.064 P18SRP protein NKAPL 0.062 NFKB activating protein-like LOC100294364 0.062 PREDICTED: hypothetical protein LOC100294088 0.055 PREDICTED: hypothetical protein, partial C9orf86 0.053 Rab-like GTP-binding protein 1 isoform 1 MAP1B 0.053 microtubule-associated protein 1B LOC100133599 0.051 PREDICTED: hypothetical protein TAF3 0.051 RNA polymerase II transcription factor TAFII140 [Ho... LOC100133599 0.051 PREDICTED: hypothetical protein INCENP 0.051 inner centromere protein antigens 135/155kDa isofor... GPATCH1 0.051 G patch domain containing 1 LOC100133698 0.051 PREDICTED: hypothetical protein PRPF40A 0.051 formin binding protein 3 RALBP1 0.048 ralA binding protein 1 UPF3B 0.048 UPF3 regulator of nonsense transcripts homolog B iso... BRD9 0.048 bromodomain containing 9 isoform 1 NKTR 0.048 natural killer-tumor recognition sequence AP3D1 0.046 adaptor-related protein complex 3, delta 1 subunit ... THOC2 0.046 THO complex 2 LOC100131202 0.046 PREDICTED: hypothetical protein SRRT 0.046 arsenate resistance protein 2 isoform e SRRT 0.046 arsenate resistance protein 2 isoform d SRRT 0.046 arsenate resistance protein 2 isoform c SRRT 0.046 arsenate resistance protein 2 isoform a NPAS3 0.046 neuronal PAS domain protein 3 isoform 2Human BLASTP results (used to prepare the table) | |||
Gene descriptions are from NCBI RefSeq. Search results were obtained with NCBI BLAST and RefSeq entries. When identical proteins are present, the self-match may not be listed first in BLASTP output. In such cases, the table above has been reordered to place it first.
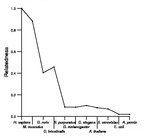
See About the Figures for the scoring system used in the figure above right. The same scoring system was used in the table of BLASTP results.
Guide to the Human Genome
Copyright © 2010 by Stewart Scherer. All rights reserved.
