
| Name: BAG1 | Sequence: fasta or formatted (345aa) | NCBI GI: 124494251 | |
|
Description: BCL2-associated athanogene isoform 1L
|
Referenced in: BCL2 Pathways, Caspases, and Programmed Cell Death
| ||
|
Composition:
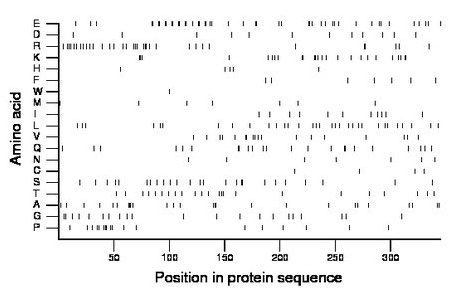
Amino acid Percentage Count Longest homopolymer A alanine 7.5 26 3 C cysteine 1.2 4 1 D aspartate 3.5 12 1 E glutamate 13.3 46 2 F phenylalanine 2.0 7 1 G glycine 6.1 21 2 H histidine 1.4 5 1 I isoleucine 3.2 11 1 K lysine 7.2 25 3 L leucine 9.3 32 1 M methionine 2.0 7 1 N asparagine 2.0 7 1 P proline 5.2 18 3 Q glutamine 6.7 23 2 R arginine 9.9 34 3 S serine 7.2 25 2 T threonine 6.7 23 1 V valine 5.2 18 2 W tryptophan 0.3 1 1 Y tyrosine 0.0 0 0 |
Comparative genomics:
Search single species RefSeq proteins at NCBI
Search summary 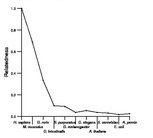
Figure data | ||
Related human proteins:Protein Relative score Description Self-match 1.000 BCL2-associated athanogene isoform 1L PLEC1 0.037 plectin 1 isoform 11 PLEC1 0.037 plectin 1 isoform 10 PLEC1 0.037 plectin 1 isoform 8 PLEC1 0.037 plectin 1 isoform 7 PLEC1 0.037 plectin 1 isoform 6 PLEC1 0.037 plectin 1 isoform 3 PLEC1 0.037 plectin 1 isoform 2 PLEC1 0.037 plectin 1 isoform 1 DEF6 0.031 differentially expressed in FDCP 6 homolog AKAP9 0.031 A-kinase anchor protein 9 isoform 2 AKAP9 0.031 A-kinase anchor protein 9 isoform 3 GOLGB1 0.031 golgi autoantigen, golgin subfamily b, macrogolgin ... PDCD7 0.031 programmed cell death 7 MICAL3 0.029 microtubule associated monoxygenase, calponin and L... PPFIA3 0.029 PTPRF interacting protein alpha 3 ERC1 0.028 RAB6-interacting protein 2 isoform epsilon ERC1 0.028 RAB6-interacting protein 2 isoform delta LOC100132799 0.028 PREDICTED: hypothetical protein MYH7B 0.028 myosin, heavy polypeptide 7B, cardiac muscle, beta ... PPFIA1 0.028 PTPRF interacting protein alpha 1 isoform a PPFIA1 0.028 PTPRF interacting protein alpha 1 isoform b SRRM2 0.028 splicing coactivator subunit SRm300 LOC727832 0.026 golgi autoantigen, golgin subfamily a-like C1orf113 0.026 SH3 domain-containing protein C1orf113 isoform 1 [H... C1orf113 0.026 SH3 domain-containing protein C1orf113 isoform 2 [H... SFRS11 0.026 splicing factor, arginine/serine-rich 11 CDC2L2 0.026 cell division cycle 2-like 2 isoform 4 CDC2L2 0.026 cell division cycle 2-like 2 isoform 1 CDC2L1 0.026 cell division cycle 2-like 1 (PITSLRE proteins) isof...Human BLASTP results (used to prepare the table) | |||
Gene descriptions are from NCBI RefSeq. Search results were obtained with NCBI BLAST and RefSeq entries. When identical proteins are present, the self-match may not be listed first in BLASTP output. In such cases, the table above has been reordered to place it first.
See About the Figures for the scoring system used in the figure above right. The same scoring system was used in the table of BLASTP results.
Guide to the Human Genome
Copyright © 2010 by Stewart Scherer. All rights reserved.
