
| Name: PAX2 | Sequence: fasta or formatted (408aa) | NCBI GI: 34878716 | |
|
Description: paired box protein 2 isoform d
|
Referenced in:
| ||
Other entries for this name:
alt prot [416aa] paired box protein 2 isoform a alt prot [393aa] paired box protein 2 isoform b alt prot [431aa] paired box protein 2 isoform e alt prot [396aa] paired box protein 2 isoform c | |||
|
Composition:
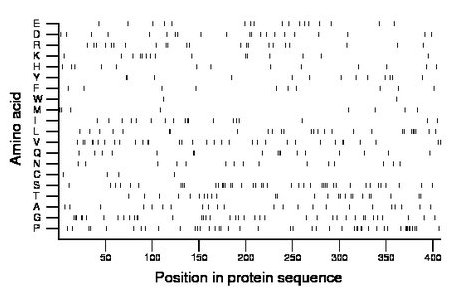
Amino acid Percentage Count Longest homopolymer A alanine 5.6 23 1 C cysteine 1.0 4 1 D aspartate 5.1 21 1 E glutamate 4.2 17 1 F phenylalanine 2.5 10 1 G glycine 9.6 39 2 H histidine 3.2 13 1 I isoleucine 4.4 18 2 K lysine 3.7 15 1 L leucine 6.6 27 2 M methionine 2.0 8 1 N asparagine 3.7 15 1 P proline 11.0 45 3 Q glutamine 4.2 17 3 R arginine 5.4 22 1 S serine 10.0 41 2 T threonine 6.1 25 2 V valine 8.1 33 2 W tryptophan 0.5 2 1 Y tyrosine 3.2 13 2 |
Comparative genomics:
Search single species RefSeq proteins at NCBI
Search summary 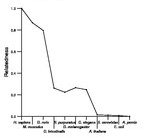
Figure data | ||
Related human proteins:Protein Relative score Description Self-match 1.000 paired box protein 2 isoform d PAX2 0.984 paired box protein 2 isoform e PAX2 0.902 paired box protein 2 isoform b PAX2 0.886 paired box protein 2 isoform a PAX2 0.822 paired box protein 2 isoform c PAX5 0.598 paired box 5 PAX8 0.552 paired box 8 isoform PAX8B PAX8 0.486 paired box 8 isoform PAX8A PAX8 0.442 paired box 8 isoform PAX8C PAX8 0.406 paired box 8 isoform PAX8D PAX8 0.403 paired box 8 isoform PAX8E PAX6 0.258 paired box gene 6 isoform a PAX6 0.258 paired box gene 6 isoform a PAX6 0.247 paired box gene 6 isoform b PAX3 0.245 paired box 3 isoform PAX3i PAX3 0.239 paired box 3 isoform PAX3g PAX3 0.239 paired box 3 isoform PAX3h PAX3 0.239 paired box 3 isoform PAX3e PAX3 0.239 paired box 3 isoform PAX3d PAX3 0.239 paired box 3 isoform PAX3 PAX7 0.237 paired box 7 isoform 2 PAX7 0.231 paired box 7 isoform 1 PAX7 0.231 paired box 7 isoform 3 PAX1 0.219 paired box 1 PAX9 0.214 paired box 9 PAX3 0.208 paired box 3 isoform PAX3b PAX3 0.208 paired box 3 isoform PAX3a PAX4 0.177 paired box 4 RAX 0.023 retina and anterior neural fold homeobox ZFR2 0.022 zinc finger RNA binding protein 2 isoform 1Human BLASTP results (used to prepare the table) | |||
Gene descriptions are from NCBI RefSeq. Search results were obtained with NCBI BLAST and RefSeq entries. When identical proteins are present, the self-match may not be listed first in BLASTP output. In such cases, the table above has been reordered to place it first.
See About the Figures for the scoring system used in the figure above right. The same scoring system was used in the table of BLASTP results.
Guide to the Human Genome
Copyright © 2010 by Stewart Scherer. All rights reserved.
