
| Name: PAX2 | Sequence: fasta or formatted (431aa) | NCBI GI: 34878703 | |
|
Description: paired box protein 2 isoform e
|
Referenced in:
| ||
Other entries for this name:
alt prot [416aa] paired box protein 2 isoform a alt prot [393aa] paired box protein 2 isoform b alt prot [396aa] paired box protein 2 isoform c alt prot [408aa] paired box protein 2 isoform d | |||
|
Composition:
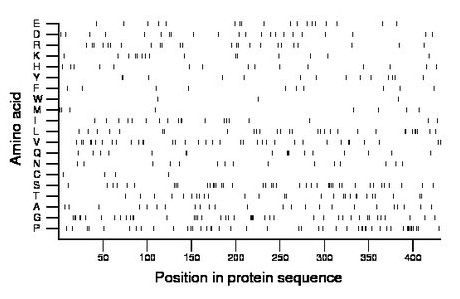
Amino acid Percentage Count Longest homopolymer A alanine 5.6 24 1 C cysteine 0.9 4 1 D aspartate 5.1 22 1 E glutamate 4.2 18 1 F phenylalanine 2.3 10 1 G glycine 10.0 43 4 H histidine 3.5 15 1 I isoleucine 4.4 19 2 K lysine 3.5 15 1 L leucine 7.0 30 2 M methionine 1.9 8 1 N asparagine 3.5 15 1 P proline 10.7 46 3 Q glutamine 3.9 17 3 R arginine 5.6 24 1 S serine 9.5 41 2 T threonine 6.3 27 2 V valine 8.4 36 2 W tryptophan 0.7 3 1 Y tyrosine 3.2 14 2 |
Comparative genomics:
Search single species RefSeq proteins at NCBI
Search summary 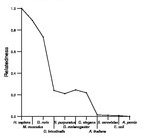
Figure data | ||
Related human proteins:Protein Relative score Description Self-match 1.000 paired box protein 2 isoform e PAX2 0.927 paired box protein 2 isoform d PAX2 0.907 paired box protein 2 isoform a PAX2 0.834 paired box protein 2 isoform b PAX2 0.759 paired box protein 2 isoform c PAX5 0.548 paired box 5 PAX8 0.509 paired box 8 isoform PAX8B PAX8 0.446 paired box 8 isoform PAX8A PAX8 0.404 paired box 8 isoform PAX8C PAX8 0.371 paired box 8 isoform PAX8D PAX8 0.368 paired box 8 isoform PAX8E PAX6 0.236 paired box gene 6 isoform a PAX6 0.236 paired box gene 6 isoform a PAX6 0.226 paired box gene 6 isoform b PAX3 0.220 paired box 3 isoform PAX3i PAX3 0.214 paired box 3 isoform PAX3g PAX3 0.214 paired box 3 isoform PAX3h PAX3 0.214 paired box 3 isoform PAX3e PAX3 0.214 paired box 3 isoform PAX3d PAX3 0.214 paired box 3 isoform PAX3 PAX7 0.213 paired box 7 isoform 2 PAX7 0.207 paired box 7 isoform 1 PAX7 0.207 paired box 7 isoform 3 PAX1 0.205 paired box 1 PAX9 0.202 paired box 9 PAX3 0.196 paired box 3 isoform PAX3b PAX3 0.196 paired box 3 isoform PAX3a PAX4 0.162 paired box 4 RAX 0.022 retina and anterior neural fold homeobox ZFR2 0.021 zinc finger RNA binding protein 2 isoform 1Human BLASTP results (used to prepare the table) | |||
Gene descriptions are from NCBI RefSeq. Search results were obtained with NCBI BLAST and RefSeq entries. When identical proteins are present, the self-match may not be listed first in BLASTP output. In such cases, the table above has been reordered to place it first.
See About the Figures for the scoring system used in the figure above right. The same scoring system was used in the table of BLASTP results.
Guide to the Human Genome
Copyright © 2010 by Stewart Scherer. All rights reserved.
