
| Name: PAX2 | Sequence: fasta or formatted (416aa) | NCBI GI: 34878699 | |
|
Description: paired box protein 2 isoform a
|
Referenced in:
| ||
Other entries for this name:
alt prot [393aa] paired box protein 2 isoform b alt prot [431aa] paired box protein 2 isoform e alt prot [396aa] paired box protein 2 isoform c alt prot [408aa] paired box protein 2 isoform d | |||
|
Composition:
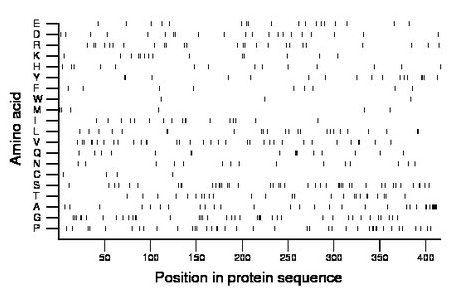
Amino acid Percentage Count Longest homopolymer A alanine 7.5 31 6 C cysteine 1.0 4 1 D aspartate 5.0 21 1 E glutamate 4.3 18 1 F phenylalanine 2.2 9 1 G glycine 9.6 40 4 H histidine 3.4 14 1 I isoleucine 4.1 17 2 K lysine 3.4 14 1 L leucine 5.8 24 2 M methionine 1.4 6 1 N asparagine 3.6 15 1 P proline 9.6 40 2 Q glutamine 3.8 16 3 R arginine 6.0 25 1 S serine 10.3 43 2 T threonine 6.0 25 2 V valine 8.2 34 2 W tryptophan 0.7 3 1 Y tyrosine 4.1 17 3 |
Comparative genomics:
Search single species RefSeq proteins at NCBI
Search summary 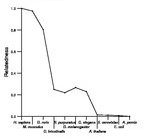
Figure data | ||
Related human proteins:Protein Relative score Description Self-match 1.000 paired box protein 2 isoform a PAX2 0.945 paired box protein 2 isoform e PAX2 0.924 paired box protein 2 isoform b PAX2 0.869 paired box protein 2 isoform d PAX2 0.790 paired box protein 2 isoform c PAX5 0.610 paired box 5 PAX8 0.554 paired box 8 isoform PAX8B PAX8 0.489 paired box 8 isoform PAX8A PAX8 0.419 paired box 8 isoform PAX8C PAX8 0.386 paired box 8 isoform PAX8D PAX8 0.384 paired box 8 isoform PAX8E PAX6 0.246 paired box gene 6 isoform a PAX6 0.246 paired box gene 6 isoform a PAX6 0.235 paired box gene 6 isoform b PAX3 0.224 paired box 3 isoform PAX3i PAX7 0.222 paired box 7 isoform 2 PAX3 0.220 paired box 3 isoform PAX3g PAX3 0.220 paired box 3 isoform PAX3h PAX3 0.220 paired box 3 isoform PAX3e PAX3 0.220 paired box 3 isoform PAX3d PAX3 0.220 paired box 3 isoform PAX3 PAX7 0.216 paired box 7 isoform 1 PAX7 0.216 paired box 7 isoform 3 PAX1 0.214 paired box 1 PAX9 0.210 paired box 9 PAX3 0.204 paired box 3 isoform PAX3b PAX3 0.204 paired box 3 isoform PAX3a PAX4 0.169 paired box 4 EVX2 0.021 even-skipped homeobox 2 DRGX 0.019 dorsal root ganglia homeoboxHuman BLASTP results (used to prepare the table) | |||
Gene descriptions are from NCBI RefSeq. Search results were obtained with NCBI BLAST and RefSeq entries. When identical proteins are present, the self-match may not be listed first in BLASTP output. In such cases, the table above has been reordered to place it first.
See About the Figures for the scoring system used in the figure above right. The same scoring system was used in the table of BLASTP results.
Guide to the Human Genome
Copyright © 2010 by Stewart Scherer. All rights reserved.
