
| Name: PAX8 | Sequence: fasta or formatted (450aa) | NCBI GI: 5803117 | |
|
Description: paired box 8 isoform PAX8A
|
Referenced in:
| ||
Other entries for this name:
alt prot [387aa] paired box 8 isoform PAX8B alt prot [398aa] paired box 8 isoform PAX8C alt prot [321aa] paired box 8 isoform PAX8D alt prot [287aa] paired box 8 isoform PAX8E | |||
|
Composition:
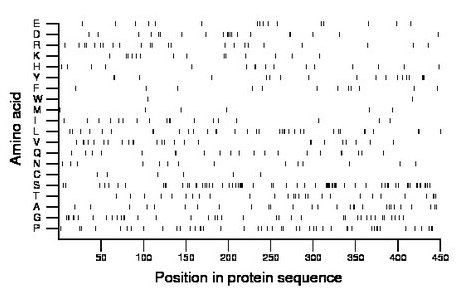
Amino acid Percentage Count Longest homopolymer A alanine 6.2 28 2 C cysteine 1.3 6 1 D aspartate 4.4 20 2 E glutamate 3.6 16 1 F phenylalanine 2.7 12 1 G glycine 8.4 38 2 H histidine 3.6 16 2 I isoleucine 4.0 18 2 K lysine 3.1 14 1 L leucine 7.8 35 2 M methionine 1.3 6 1 N asparagine 3.1 14 1 P proline 10.0 45 2 Q glutamine 4.7 21 2 R arginine 5.1 23 1 S serine 14.7 66 5 T threonine 6.0 27 2 V valine 5.6 25 2 W tryptophan 0.4 2 1 Y tyrosine 4.0 18 3 |
Comparative genomics:
Search single species RefSeq proteins at NCBI
Search summary 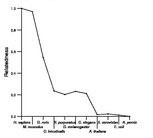
Figure data | ||
Related human proteins:Protein Relative score Description Self-match 1.000 paired box 8 isoform PAX8A PAX8 0.744 paired box 8 isoform PAX8B PAX8 0.662 paired box 8 isoform PAX8C PAX8 0.569 paired box 8 isoform PAX8D PAX8 0.568 paired box 8 isoform PAX8E PAX2 0.465 paired box protein 2 isoform b PAX2 0.454 paired box protein 2 isoform a PAX2 0.442 paired box protein 2 isoform d PAX2 0.431 paired box protein 2 isoform e PAX5 0.409 paired box 5 PAX2 0.396 paired box protein 2 isoform c PAX6 0.226 paired box gene 6 isoform a PAX6 0.226 paired box gene 6 isoform a PAX6 0.215 paired box gene 6 isoform b PAX3 0.212 paired box 3 isoform PAX3i PAX3 0.206 paired box 3 isoform PAX3e PAX3 0.206 paired box 3 isoform PAX3d PAX3 0.206 paired box 3 isoform PAX3 PAX3 0.204 paired box 3 isoform PAX3g PAX3 0.204 paired box 3 isoform PAX3h PAX7 0.202 paired box 7 isoform 2 PAX7 0.196 paired box 7 isoform 1 PAX7 0.196 paired box 7 isoform 3 PAX1 0.189 paired box 1 PAX9 0.189 paired box 9 PAX3 0.186 paired box 3 isoform PAX3b PAX3 0.186 paired box 3 isoform PAX3a PAX4 0.156 paired box 4 MYOCD 0.021 myocardin isoform 1 MYOCD 0.021 myocardin isoform 3Human BLASTP results (used to prepare the table) | |||
Gene descriptions are from NCBI RefSeq. Search results were obtained with NCBI BLAST and RefSeq entries. When identical proteins are present, the self-match may not be listed first in BLASTP output. In such cases, the table above has been reordered to place it first.
See About the Figures for the scoring system used in the figure above right. The same scoring system was used in the table of BLASTP results.
Guide to the Human Genome
Copyright © 2010 by Stewart Scherer. All rights reserved.
