| Name: MTIF3 | Sequence: fasta or formatted (278aa) | NCBI GI: 32306536 | |
|
Description: mitochondrial translational initiation factor 3
|
Referenced in:
| ||
|
Composition:

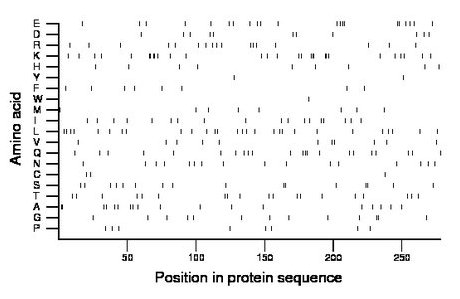
Amino acid Percentage Count Longest homopolymer A alanine 6.5 18 2 C cysteine 1.1 3 1 D aspartate 4.0 11 1 E glutamate 7.6 21 2 F phenylalanine 2.9 8 1 G glycine 4.7 13 2 H histidine 3.2 9 1 I isoleucine 6.5 18 1 K lysine 10.4 29 3 L leucine 10.1 28 1 M methionine 2.9 8 1 N asparagine 5.8 16 1 P proline 2.9 8 1 Q glutamine 7.9 22 2 R arginine 6.1 17 1 S serine 5.8 16 2 T threonine 6.8 19 1 V valine 4.0 11 1 W tryptophan 0.4 1 1 Y tyrosine 0.7 2 1 |
Comparative genomics:
Search single species RefSeq proteins at NCBI
Search summary 
Figure data | ||
Related human proteins:Protein Relative score Description Self-match 1.000 mitochondrial translational initiation factor 3 [Hom... SFRS12IP1 0.021 P18SRP protein IQCA1 0.015 IQ motif containing with AAA domain 1 CCDC46 0.013 coiled-coil domain containing 46 isoform a TAGAP 0.013 T-cell activation Rho GTPase-activating protein isof... TAGAP 0.013 T-cell activation Rho GTPase-activating protein isof... NAP5 0.011 Nck-associated protein 5 isoform 2 NAP5 0.011 Nck-associated protein 5 isoform 1 GCC2 0.010 GRIP and coiled-coil domain-containing 2 GCOM1 0.010 GRINL1A combined protein isoform 2 GCOM1 0.010 GRINL1A combined protein isoform 1 GCOM1 0.010 GRINL1A upstream protein isoform 7 CCDC41 0.010 NY-REN-58 antigen CCDC41 0.010 NY-REN-58 antigen APOF 0.010 apolipoprotein F precursor DDX23 0.010 DEAD (Asp-Glu-Ala-Asp) box polypeptide 23 SAMD9 0.010 sterile alpha motif domain containing 9 NAV1 0.008 neuron navigator 1 USP28 0.008 ubiquitin specific protease 28 CCDC73 0.008 sarcoma antigen NY-SAR-79 NCAPG 0.006 chromosome condensation protein G GCOM1 0.006 GRINL1A combined protein isoform 8 SMC6 0.006 SMC6 protein SMC6 0.006 SMC6 proteinHuman BLASTP results (used to prepare the table) | |||
Gene descriptions are from NCBI RefSeq. Search results were obtained with NCBI BLAST and RefSeq entries. When identical proteins are present, the self-match may not be listed first in BLASTP output. In such cases, the table above has been reordered to place it first.
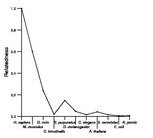
See About the Figures for the scoring system used in the figure above right. The same scoring system was used in the table of BLASTP results.
Guide to the Human Genome
Copyright © 2010 by Stewart Scherer. All rights reserved.
