
| Name: NECAP1 | Sequence: fasta or formatted (275aa) | NCBI GI: 31542528 | |
|
Description: NECAP endocytosis associated 1
|
Referenced in: ER, Golgi, and the Secretory Pathway
| ||
|
Composition:
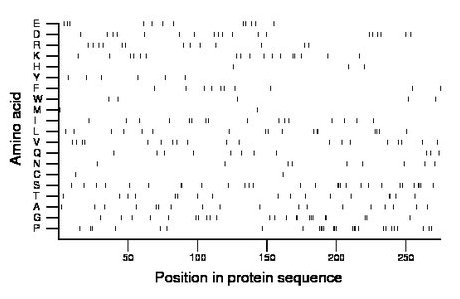
Amino acid Percentage Count Longest homopolymer A alanine 6.5 18 1 C cysteine 0.7 2 1 D aspartate 6.9 19 1 E glutamate 4.4 12 1 F phenylalanine 3.6 10 1 G glycine 8.4 23 3 H histidine 1.1 3 1 I isoleucine 5.8 16 1 K lysine 6.2 17 2 L leucine 6.2 17 2 M methionine 0.7 2 1 N asparagine 3.3 9 1 P proline 9.8 27 4 Q glutamine 4.0 11 1 R arginine 4.7 13 1 S serine 10.5 29 3 T threonine 6.2 17 2 V valine 6.9 19 1 W tryptophan 1.8 5 1 Y tyrosine 2.2 6 1 |
Comparative genomics:
Search single species RefSeq proteins at NCBI
Search summary 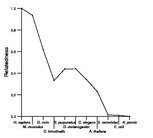
Figure data | ||
Related human proteins:Protein Relative score Description Self-match 1.000 NECAP endocytosis associated 1 NECAP2 0.589 NECAP endocytosis associated 2 isoform 1 NECAP2 0.537 NECAP endocytosis associated 2 isoform 2 NECAP2 0.494 NECAP endocytosis associated 2 isoform 3 ZNF358 0.033 zinc finger protein 358 ITSN1 0.024 intersectin 1 isoform ITSN-s ITSN1 0.024 intersectin 1 isoform ITSN-l PRDM2 0.022 retinoblastoma protein-binding zinc finger protein i... PRDM2 0.022 retinoblastoma protein-binding zinc finger protein i... PRDM2 0.022 retinoblastoma protein-binding zinc finger protein i... MUC2 0.019 mucin 2 precursor LOC729580 0.019 PREDICTED: hypothetical protein LOC729580 0.019 PREDICTED: hypothetical protein LOC729580 0.019 PREDICTED: hypothetical protein MUC4 0.019 mucin 4 isoform a FMN2 0.019 formin 2 POM121C 0.019 POM121 membrane glycoprotein (rat)-like POM121 0.019 nuclear pore membrane protein 121 DIAPH1 0.019 diaphanous 1 isoform 2 DIAPH1 0.019 diaphanous 1 isoform 1 PRR12 0.019 proline rich 12 NACAD 0.017 NAC alpha domain containing NACAD 0.017 PREDICTED: NAC alpha domain containing NACAD 0.017 PREDICTED: NAC alpha domain containing NACAD 0.017 PREDICTED: NAC alpha domain containing LOC729370 0.017 PREDICTED: hypothetical protein NACAD 0.017 PREDICTED: NAC alpha domain containing WIPF1 0.017 WAS/WASL interacting protein family, member 1 [Homo... WIPF1 0.017 WAS/WASL interacting protein family, member 1 APBB1IP 0.017 amyloid beta (A4) precursor protein-binding, family ...Human BLASTP results (used to prepare the table) | |||
Gene descriptions are from NCBI RefSeq. Search results were obtained with NCBI BLAST and RefSeq entries. When identical proteins are present, the self-match may not be listed first in BLASTP output. In such cases, the table above has been reordered to place it first.
See About the Figures for the scoring system used in the figure above right. The same scoring system was used in the table of BLASTP results.
Guide to the Human Genome
Copyright © 2010 by Stewart Scherer. All rights reserved.
