
| Name: PSMD10 | Sequence: fasta or formatted (151aa) | NCBI GI: 28605137 | |
|
Description: proteasome 26S non-ATPase subunit 10 isform 2
|
Referenced in: Ankyrin Family
| ||
Other entries for this name:
alt prot [226aa] proteasome 26S non-ATPase subunit 10 isoform 1 | |||
|
Composition:
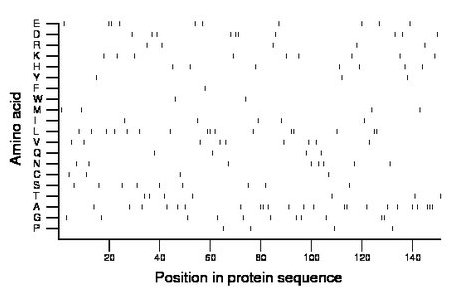
Amino acid Percentage Count Longest homopolymer A alanine 15.2 23 3 C cysteine 2.6 4 1 D aspartate 6.6 10 2 E glutamate 6.6 10 2 F phenylalanine 0.7 1 1 G glycine 7.3 11 2 H histidine 4.6 7 1 I isoleucine 3.3 5 1 K lysine 6.0 9 1 L leucine 10.6 16 2 M methionine 2.6 4 1 N asparagine 5.3 8 1 P proline 2.6 4 1 Q glutamine 2.6 4 1 R arginine 3.3 5 1 S serine 6.0 9 1 T threonine 4.6 7 1 V valine 6.0 9 1 W tryptophan 1.3 2 1 Y tyrosine 2.0 3 1 |
Comparative genomics:
Search single species RefSeq proteins at NCBI
Search summary 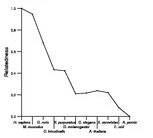
Figure data | ||
Related human proteins:Protein Relative score Description Self-match 1.000 proteasome 26S non-ATPase subunit 10 isform 2 PSMD10 0.986 proteasome 26S non-ATPase subunit 10 isoform 1 TNKS2 0.216 tankyrase, TRF1-interacting ankyrin-related ADP-ribo... ANKRD28 0.216 ankyrin repeat domain 28 ANKRD31 0.213 PREDICTED: ankyrin repeat domain 31 ANKRD31 0.213 PREDICTED: ankyrin repeat domain 31 ANKRD31 0.213 PREDICTED: ankyrin repeat domain 31 ANKRD44 0.213 ankyrin repeat domain 44 ANK2 0.209 ankyrin 2 isoform 3 ANK2 0.209 ankyrin 2 isoform 2 ANK2 0.209 ankyrin 2 isoform 1 TNKS 0.202 tankyrase, TRF1-interacting ankyrin-related ADP-ribo... ANK3 0.202 ankyrin 3 isoform 1 ANKRD23 0.202 diabetes related ankyrin repeat protein ANK1 0.195 ankyrin 1 isoform 9 ANK1 0.195 ankyrin 1 isoform 1 ANK1 0.195 ankyrin 1 isoform 3 ANK1 0.195 ankyrin 1 isoform 2 ANK1 0.195 ankyrin 1 isoform 4 ANKRD52 0.195 ankyrin repeat domain 52 PPP1R12C 0.191 protein phosphatase 1, regulatory subunit 12C ANKRD2 0.191 ankyrin repeat domain 2 isoform a ANKRD50 0.188 ankyrin repeat domain 50 TNNI3K 0.184 TNNI3 interacting kinase isoform b TNNI3K 0.184 TNNI3 interacting kinase isoform a ANKRD12 0.184 ankyrin repeat domain 12 isoform 2 ANKRD12 0.184 ankyrin repeat domain 12 isoform 1 ILK 0.184 integrin-linked kinase ILK 0.184 integrin-linked kinase ILK 0.184 integrin-linked kinaseHuman BLASTP results (used to prepare the table) | |||
Gene descriptions are from NCBI RefSeq. Search results were obtained with NCBI BLAST and RefSeq entries. When identical proteins are present, the self-match may not be listed first in BLASTP output. In such cases, the table above has been reordered to place it first.
See About the Figures for the scoring system used in the figure above right. The same scoring system was used in the table of BLASTP results.
Guide to the Human Genome
Copyright © 2010 by Stewart Scherer. All rights reserved.
