
| Name: CTTNBP2NL | Sequence: fasta or formatted (639aa) | NCBI GI: 24308179 | |
|
Description: CTTNBP2 N-terminal like
|
Referenced in:
| ||
|
Composition:
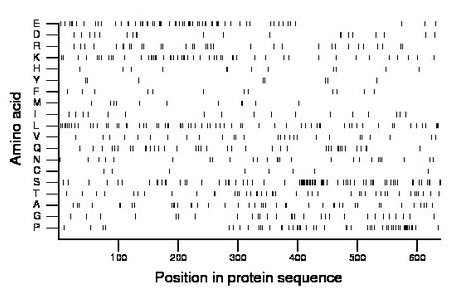
Amino acid Percentage Count Longest homopolymer A alanine 7.0 45 3 C cysteine 1.3 8 1 D aspartate 3.1 20 2 E glutamate 9.7 62 3 F phenylalanine 1.9 12 1 G glycine 4.5 29 2 H histidine 1.9 12 1 I isoleucine 2.7 17 1 K lysine 8.1 52 2 L leucine 10.2 65 3 M methionine 1.9 12 1 N asparagine 4.1 26 2 P proline 7.7 49 3 Q glutamine 6.1 39 2 R arginine 5.2 33 1 S serine 11.9 76 3 T threonine 7.0 45 2 V valine 4.5 29 2 W tryptophan 0.0 0 0 Y tyrosine 1.3 8 1 |
Comparative genomics:
Search single species RefSeq proteins at NCBI
Search summary 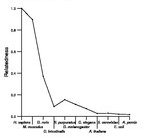
Figure data | ||
Related human proteins:Protein Relative score Description Self-match 1.000 CTTNBP2 N-terminal like CTTNBP2 0.293 cortactin binding protein 2 FILIP1 0.103 filamin A interacting protein 1 FILIP1L 0.098 filamin A interacting protein 1-like isoform 3 [Hom... FILIP1L 0.098 filamin A interacting protein 1-like isoform 1 [Hom... FILIP1L 0.042 filamin A interacting protein 1-like isoform 2 [Hom... MYH9 0.037 myosin, heavy polypeptide 9, non-muscle EPS15 0.036 epidermal growth factor receptor pathway substrate 15... AKAP9 0.033 A-kinase anchor protein 9 isoform 2 AKAP9 0.033 A-kinase anchor protein 9 isoform 3 NUMA1 0.033 nuclear mitotic apparatus protein 1 MYH11 0.032 smooth muscle myosin heavy chain 11 isoform SM1A [Ho... MYH11 0.032 smooth muscle myosin heavy chain 11 isoform SM1B [Ho... MYH11 0.032 smooth muscle myosin heavy chain 11 isoform SM2B [Ho... MYH11 0.032 smooth muscle myosin heavy chain 11 isoform SM2A [Ho... FBF1 0.032 Fas (TNFRSF6) binding factor 1 EPS15 0.030 epidermal growth factor receptor pathway substrate ... INCENP 0.030 inner centromere protein antigens 135/155kDa isofor... PCNT 0.029 pericentrin SYCP1 0.029 synaptonemal complex protein 1 TCHH 0.029 trichohyalin INCENP 0.029 inner centromere protein antigens 135/155kDa isofor... MYH8 0.029 myosin, heavy chain 8, skeletal muscle, perinatal [... MYH4 0.029 myosin, heavy polypeptide 4, skeletal muscle NIN 0.029 ninein isoform 4 NIN 0.029 ninein isoform 5 NIN 0.029 ninein isoform 1 NIN 0.029 ninein isoform 2 MYH3 0.028 myosin, heavy chain 3, skeletal muscle, embryonic [H... MYH10 0.028 myosin, heavy polypeptide 10, non-muscleHuman BLASTP results (used to prepare the table) | |||
Gene descriptions are from NCBI RefSeq. Search results were obtained with NCBI BLAST and RefSeq entries. When identical proteins are present, the self-match may not be listed first in BLASTP output. In such cases, the table above has been reordered to place it first.
See About the Figures for the scoring system used in the figure above right. The same scoring system was used in the table of BLASTP results.
Guide to the Human Genome
Copyright © 2010 by Stewart Scherer. All rights reserved.
