
| Name: FBF1 | Sequence: fasta or formatted (1133aa) | NCBI GI: 122937382 | |
|
Description: Fas (TNFRSF6) binding factor 1
|
Referenced in:
| ||
|
Composition:
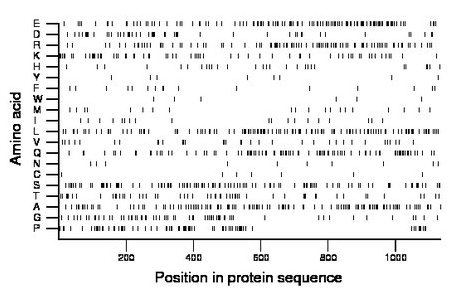
Amino acid Percentage Count Longest homopolymer A alanine 10.6 120 3 C cysteine 0.6 7 1 D aspartate 4.4 50 2 E glutamate 10.6 120 3 F phenylalanine 1.6 18 2 G glycine 5.6 64 2 H histidine 2.6 29 1 I isoleucine 1.8 20 2 K lysine 5.9 67 2 L leucine 11.0 125 3 M methionine 1.9 22 1 N asparagine 0.9 10 1 P proline 6.5 74 3 Q glutamine 8.6 98 4 R arginine 8.5 96 3 S serine 9.7 110 3 T threonine 4.9 55 2 V valine 3.0 34 2 W tryptophan 0.5 6 1 Y tyrosine 0.7 8 1 |
Comparative genomics:
Search single species RefSeq proteins at NCBI
Search summary 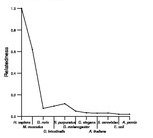
Figure data | ||
Related human proteins:Protein Relative score Description Self-match 1.000 Fas (TNFRSF6) binding factor 1 LOC645202 0.045 PREDICTED: hypothetical protein LOC645202 LOC283767 0.044 golgi autoantigen, golgin subfamily a-like LOC440243 0.043 PREDICTED: Putative golgin subfamily A member 6-lik... LOC727832 0.043 golgi autoantigen, golgin subfamily a-like TCHH 0.043 trichohyalin PLEC1 0.039 plectin 1 isoform 11 PLEC1 0.039 plectin 1 isoform 10 PLEC1 0.039 plectin 1 isoform 8 PLEC1 0.039 plectin 1 isoform 7 PLEC1 0.039 plectin 1 isoform 6 PLEC1 0.039 plectin 1 isoform 3 PLEC1 0.039 plectin 1 isoform 2 PLEC1 0.039 plectin 1 isoform 1 LOC283685 0.039 PREDICTED: golgi autoantigen, golgin subfamily a-li... CCDC88B 0.038 coiled-coil domain containing 88 CEP250 0.037 centrosomal protein 2 LOC283685 0.035 PREDICTED: golgi autoantigen, golgin subfamily a-li... MAD1L1 0.034 MAD1-like 1 protein MAD1L1 0.034 MAD1-like 1 protein MAD1L1 0.034 MAD1-like 1 protein CGNL1 0.034 cingulin-like 1 GOLGA3 0.034 Golgi autoantigen, golgin subfamily a, 3 MYH14 0.033 myosin, heavy chain 14 isoform 1 MYH14 0.033 myosin, heavy chain 14 isoform 2 MYH14 0.033 myosin, heavy chain 14 isoform 3 LOC100133758 0.033 PREDICTED: hypothetical protein, partial CROCC 0.033 ciliary rootlet coiled-coil NUMA1 0.033 nuclear mitotic apparatus protein 1 CEP110 0.033 centrosomal protein 110kDaHuman BLASTP results (used to prepare the table) | |||
Gene descriptions are from NCBI RefSeq. Search results were obtained with NCBI BLAST and RefSeq entries. When identical proteins are present, the self-match may not be listed first in BLASTP output. In such cases, the table above has been reordered to place it first.
See About the Figures for the scoring system used in the figure above right. The same scoring system was used in the table of BLASTP results.
Guide to the Human Genome
Copyright © 2010 by Stewart Scherer. All rights reserved.
