
| Name: GLTSCR2 | Sequence: fasta or formatted (478aa) | NCBI GI: 239787829 | |
|
Description: glioma tumor suppressor candidate region gene 2
|
Referenced in: Nucleus and Nucleolus
| ||
|
Composition:
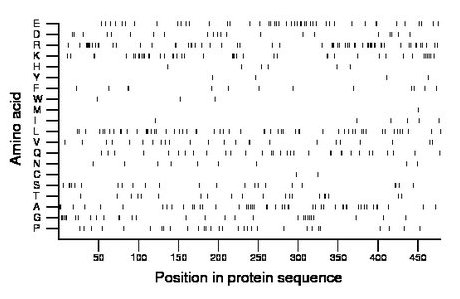
Amino acid Percentage Count Longest homopolymer A alanine 9.8 47 2 C cysteine 0.4 2 1 D aspartate 4.4 21 1 E glutamate 9.6 46 2 F phenylalanine 2.9 14 2 G glycine 6.1 29 2 H histidine 1.3 6 1 I isoleucine 1.3 6 1 K lysine 9.0 43 3 L leucine 11.9 57 3 M methionine 0.4 2 1 N asparagine 1.9 9 1 P proline 6.3 30 1 Q glutamine 6.7 32 2 R arginine 12.6 60 5 S serine 4.8 23 2 T threonine 4.2 20 2 V valine 5.0 24 1 W tryptophan 0.6 3 1 Y tyrosine 0.8 4 1 |
Comparative genomics:
Search single species RefSeq proteins at NCBI
Search summary 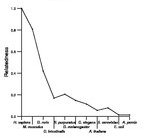
Figure data | ||
Related human proteins:Protein Relative score Description Self-match 1.000 glioma tumor suppressor candidate region gene 2 [Ho... TCHH 0.029 trichohyalin INCENP 0.025 inner centromere protein antigens 135/155kDa isofor... INCENP 0.025 inner centromere protein antigens 135/155kDa isofor... PLEC1 0.020 plectin 1 isoform 11 PLEC1 0.020 plectin 1 isoform 10 PLEC1 0.020 plectin 1 isoform 8 PLEC1 0.020 plectin 1 isoform 7 PLEC1 0.020 plectin 1 isoform 6 PLEC1 0.020 plectin 1 isoform 3 PLEC1 0.020 plectin 1 isoform 2 PLEC1 0.020 plectin 1 isoform 1 LOC100286959 0.018 PREDICTED: hypothetical protein XP_002343921 AUTS2 0.016 autism susceptibility candidate 2 isoform 2 AUTS2 0.016 autism susceptibility candidate 2 isoform 1 MAP7D1 0.016 MAP7 domain containing 1 GIGYF2 0.016 GRB10 interacting GYF protein 2 isoform c GIGYF2 0.016 GRB10 interacting GYF protein 2 isoform a GIGYF2 0.016 GRB10 interacting GYF protein 2 isoform b GIGYF2 0.016 GRB10 interacting GYF protein 2 isoform b MLLT4 0.016 myeloid/lymphoid or mixed-lineage leukemia (trithora... MYH14 0.016 myosin, heavy chain 14 isoform 1 MYH14 0.016 myosin, heavy chain 14 isoform 2 MYH14 0.016 myosin, heavy chain 14 isoform 3 MYH7B 0.016 myosin, heavy polypeptide 7B, cardiac muscle, beta ... CROCC 0.015 ciliary rootlet coiled-coil NEXN 0.015 nexilin (F actin binding protein) CCHCR1 0.014 coiled-coil alpha-helical rod protein 1 isoform 1 [... AZI1 0.014 5-azacytidine induced 1 isoform b MAP7D2 0.014 MAP7 domain containing 2Human BLASTP results (used to prepare the table) | |||
Gene descriptions are from NCBI RefSeq. Search results were obtained with NCBI BLAST and RefSeq entries. When identical proteins are present, the self-match may not be listed first in BLASTP output. In such cases, the table above has been reordered to place it first.
See About the Figures for the scoring system used in the figure above right. The same scoring system was used in the table of BLASTP results.
Guide to the Human Genome
Copyright © 2010 by Stewart Scherer. All rights reserved.
