
| Name: SPIC | Sequence: fasta or formatted (248aa) | NCBI GI: 22748707 | |
|
Description: Spi-C transcription factor (Spi-1/PU.1 related)
|
Referenced in:
| ||
|
Composition:
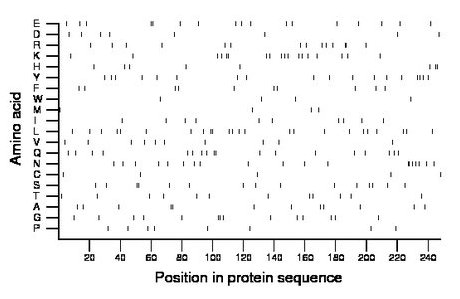
Amino acid Percentage Count Longest homopolymer A alanine 4.8 12 2 C cysteine 2.0 5 1 D aspartate 3.2 8 1 E glutamate 6.9 17 2 F phenylalanine 4.0 10 1 G glycine 5.6 14 2 H histidine 3.2 8 2 I isoleucine 4.0 10 1 K lysine 7.3 18 2 L leucine 9.7 24 2 M methionine 1.6 4 1 N asparagine 7.7 19 2 P proline 3.2 8 1 Q glutamine 7.3 18 2 R arginine 5.6 14 2 S serine 6.0 15 2 T threonine 4.8 12 1 V valine 4.0 10 1 W tryptophan 1.6 4 1 Y tyrosine 7.3 18 1 |
Comparative genomics:
Search single species RefSeq proteins at NCBI
Search summary 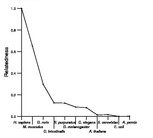
Figure data | ||
Related human proteins:Protein Relative score Description Self-match 1.000 Spi-C transcription factor (Spi-1/PU.1 related) [Hom... SPI1 0.194 hematopoietic transcription factor PU.1 isoform 1 [... SPI1 0.194 hematopoietic transcription factor PU.1 isoform 2 [... SPIB 0.186 Spi-B transcription factor (Spi-1/PU.1 related) [Hom... ELF5 0.085 E74-like factor 5 ESE-2a ELF5 0.085 E74-like factor 5 ESE-2b EHF 0.075 ets homologous factor SPDEF 0.069 SAM pointed domain containing ets transcription facto... ELF4 0.067 E74-like factor 4 ELF4 0.067 E74-like factor 4 ELF1 0.067 E74-like factor 1 (ets domain transcription factor) ... ELF1 0.067 E74-like factor 1 (ets domain transcription factor)... ETV6 0.063 ets variant 6 ELF3 0.063 E74-like factor 3 (ets domain transcription factor,... ELF3 0.063 E74-like factor 3 (ets domain transcription factor,... ETV7 0.061 ets variant 7 ELF2 0.059 E74-like factor 2 (ets domain transcription factor) ... ELF2 0.059 E74-like factor 2 (ets domain transcription factor) i... FLI1 0.059 Friend leukemia virus integration 1 ERG 0.057 ets-related isoform 4 ERG 0.057 ets-related isoform 2 ERG 0.057 ets-related isoform 1 ERG 0.057 ets-related isoform 3 ETV2 0.055 ets variant gene 2 GABPA 0.055 GA binding protein transcription factor, alpha subun... ETV3 0.051 ets variant gene 3 isoform 1 ETV3 0.051 ets variant gene 3 isoform 2 ETV3L 0.051 ets variant 3-like FEV 0.046 FEV (ETS oncogene family) ELK1 0.044 ELK1 proteinHuman BLASTP results (used to prepare the table) | |||
Gene descriptions are from NCBI RefSeq. Search results were obtained with NCBI BLAST and RefSeq entries. When identical proteins are present, the self-match may not be listed first in BLASTP output. In such cases, the table above has been reordered to place it first.
See About the Figures for the scoring system used in the figure above right. The same scoring system was used in the table of BLASTP results.
Guide to the Human Genome
Copyright © 2010 by Stewart Scherer. All rights reserved.
