
| Name: FEV | Sequence: fasta or formatted (238aa) | NCBI GI: 8923789 | |
|
Description: FEV (ETS oncogene family)
|
Referenced in:
| ||
|
Composition:
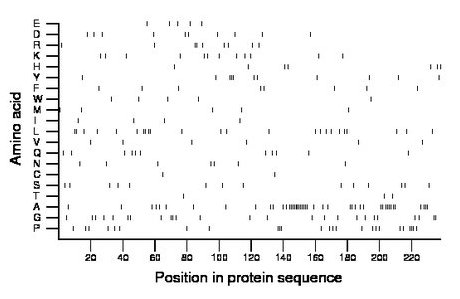
Amino acid Percentage Count Longest homopolymer A alanine 18.9 45 12 C cysteine 0.8 2 1 D aspartate 4.2 10 1 E glutamate 2.1 5 1 F phenylalanine 3.4 8 1 G glycine 10.5 25 2 H histidine 2.9 7 1 I isoleucine 1.7 4 1 K lysine 5.0 12 1 L leucine 10.1 24 2 M methionine 2.1 5 1 N asparagine 2.9 7 1 P proline 10.5 25 3 Q glutamine 4.6 11 1 R arginine 3.8 9 2 S serine 5.9 14 1 T threonine 1.3 3 1 V valine 2.5 6 1 W tryptophan 2.1 5 1 Y tyrosine 4.6 11 3 |
Comparative genomics:
Search single species RefSeq proteins at NCBI
Search summary 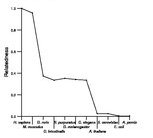
Figure data | ||
Related human proteins:Protein Relative score Description Self-match 1.000 FEV (ETS oncogene family) FLI1 0.365 Friend leukemia virus integration 1 ERG 0.355 ets-related isoform 4 ERG 0.355 ets-related isoform 2 ERG 0.355 ets-related isoform 1 ERG 0.355 ets-related isoform 3 ETS2 0.225 v-ets erythroblastosis virus E26 oncogene homolog 2 [... ETS1 0.225 v-ets erythroblastosis virus E26 oncogene homolog 1... ETS1 0.225 v-ets erythroblastosis virus E26 oncogene homolog 1 i... ETS1 0.225 v-ets erythroblastosis virus E26 oncogene homolog 1... LOC390937 0.219 PREDICTED: similar to hCG2040171 LOC390937 0.219 PREDICTED: similar to hCG2040171 LOC390937 0.219 PREDICTED: similar to hCG2040171 ERF 0.219 Ets2 repressor factor GABPA 0.206 GA binding protein transcription factor, alpha subun... ETV3L 0.197 ets variant 3-like ETV3 0.195 ets variant gene 3 isoform 1 ETV3 0.195 ets variant gene 3 isoform 2 ELK1 0.195 ELK1 protein ELK1 0.195 ELK1 protein ETV5 0.193 ets variant gene 5 (ets-related molecule) ETV2 0.191 ets variant gene 2 ETV1 0.189 ets variant gene 1 isoform f ETV1 0.189 ets variant gene 1 isoform e ETV1 0.189 ets variant gene 1 isoform d ETV1 0.189 ets variant gene 1 isoform c ETV1 0.189 ets variant gene 1 isoform c ETV1 0.189 ets variant gene 1 isoform b ETV1 0.189 ets variant gene 1 isoform a ETV4 0.187 ets variant gene 4 (E1A enhancer binding protein, E...Human BLASTP results (used to prepare the table) | |||
Gene descriptions are from NCBI RefSeq. Search results were obtained with NCBI BLAST and RefSeq entries. When identical proteins are present, the self-match may not be listed first in BLASTP output. In such cases, the table above has been reordered to place it first.
See About the Figures for the scoring system used in the figure above right. The same scoring system was used in the table of BLASTP results.
Guide to the Human Genome
Copyright © 2010 by Stewart Scherer. All rights reserved.
