
| Name: TCP10L | Sequence: fasta or formatted (215aa) | NCBI GI: 21389535 | |
|
Description: T-complex 10A-2
|
Referenced in:
| ||
|
Composition:
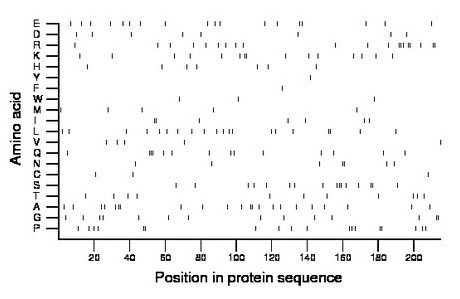
Amino acid Percentage Count Longest homopolymer A alanine 10.2 22 2 C cysteine 1.4 3 1 D aspartate 3.7 8 1 E glutamate 8.4 18 2 F phenylalanine 0.5 1 1 G glycine 6.5 14 2 H histidine 3.3 7 1 I isoleucine 3.3 7 2 K lysine 7.0 15 2 L leucine 9.3 20 2 M methionine 2.3 5 1 N asparagine 3.3 7 2 P proline 8.4 18 2 Q glutamine 6.5 14 3 R arginine 9.3 20 3 S serine 7.4 16 3 T threonine 5.1 11 1 V valine 2.3 5 1 W tryptophan 1.4 3 1 Y tyrosine 0.5 1 1 |
Comparative genomics:
Search single species RefSeq proteins at NCBI
Search summary 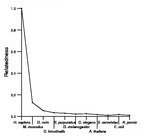
Figure data | ||
Related human proteins:Protein Relative score Description Self-match 1.000 T-complex 10A-2 TCP10L2 0.748 t-complex 10-like 2 TCP10 0.614 t-complex 10 CENPJ 0.078 centromere protein J NUMA1 0.039 nuclear mitotic apparatus protein 1 SUPT6H 0.029 suppressor of Ty 6 homolog C10orf141 0.029 hypothetical protein LOC642938 EFCAB4B 0.024 EF-hand calcium binding domain 4B isoform a AP1GBP1 0.022 AP1 gamma subunit binding protein 1 isoform 2 AP1GBP1 0.022 AP1 gamma subunit binding protein 1 isoform 1 ANGPTL6 0.019 angiopoietin-like 6 EFCAB4B 0.019 EF-hand calcium binding domain 4B isoform b CEP250 0.019 centrosomal protein 2 RALBP1 0.019 ralA binding protein 1 PRPF4B 0.017 serine/threonine-protein kinase PRP4K MYH14 0.017 myosin, heavy chain 14 isoform 1 MYH14 0.017 myosin, heavy chain 14 isoform 2 MYH14 0.017 myosin, heavy chain 14 isoform 3 CROCC 0.017 ciliary rootlet coiled-coil CCDC61 0.017 coiled-coil domain containing 61 LOC100271715 0.017 DH and coiled-coil domain-containing protein KLRAQ1 0.017 KLRAQ motif containing 1 isoform 3 KLRAQ1 0.017 KLRAQ motif containing 1 isoform 2 KLRAQ1 0.017 KLRAQ motif containing 1 isoform 1 HMGXB3 0.015 HMG box domain containing 3 PCLO 0.015 piccolo isoform 2 PCLO 0.015 piccolo isoform 1 KIAA1549 0.015 hypothetical protein LOC57670 CARD9 0.015 caspase recruitment domain protein 9 isoform 2 [Homo... CARD9 0.015 caspase recruitment domain protein 9 isoform 1 [Homo...Human BLASTP results (used to prepare the table) | |||
Gene descriptions are from NCBI RefSeq. Search results were obtained with NCBI BLAST and RefSeq entries. When identical proteins are present, the self-match may not be listed first in BLASTP output. In such cases, the table above has been reordered to place it first.
See About the Figures for the scoring system used in the figure above right. The same scoring system was used in the table of BLASTP results.
Guide to the Human Genome
Copyright © 2010 by Stewart Scherer. All rights reserved.
