
| Name: MYCN | Sequence: fasta or formatted (464aa) | NCBI GI: 19923312 | |
|
Description: v-myc myelocytomatosis viral related oncogene, neuroblastoma derived
|
Referenced in: Myc and Related Functions
| ||
|
Composition:
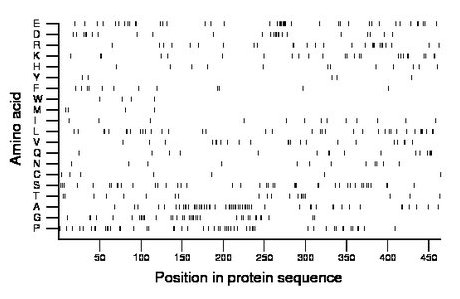
Amino acid Percentage Count Longest homopolymer A alanine 11.4 53 2 C cysteine 1.5 7 1 D aspartate 5.2 24 2 E glutamate 9.1 42 4 F phenylalanine 2.6 12 1 G glycine 7.8 36 2 H histidine 2.6 12 1 I isoleucine 2.8 13 1 K lysine 5.6 26 2 L leucine 8.0 37 3 M methionine 1.1 5 1 N asparagine 2.6 12 1 P proline 10.8 50 2 Q glutamine 3.4 16 3 R arginine 5.6 26 3 S serine 9.1 42 3 T threonine 4.3 20 2 V valine 4.7 22 2 W tryptophan 0.9 4 1 Y tyrosine 1.1 5 1 |
Comparative genomics:
Search single species RefSeq proteins at NCBI
Search summary 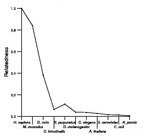
Figure data | ||
Related human proteins:Protein Relative score Description Self-match 1.000 v-myc myelocytomatosis viral related oncogene, neuro... MYC 0.246 myc proto-oncogene protein MYCL1 0.136 l-myc-1 proto-oncogene isoform 1 MYCL1 0.136 l-myc-1 proto-oncogene isoform 1 MYCL1 0.077 l-myc-1 proto-oncogene isoform 2 MAX 0.043 MAX protein isoform b LOC100293553 0.040 PREDICTED: similar to L-myc-2 protein, partial [Hom... MAX 0.039 MAX protein isoform a MAX 0.038 MAX protein isoform e MAX 0.037 MAX protein isoform c MLXIPL 0.034 Williams Beuren syndrome chromosome region 14 isofor... RANBP9 0.033 RAN binding protein 9 MLXIPL 0.031 Williams Beuren syndrome chromosome region 14 isofor... TFE3 0.031 transcription factor E3 AMOT 0.029 angiomotin isoform 2 AMOT 0.029 angiomotin isoform 1 FAM48B1 0.029 hypothetical protein LOC100130302 OGFR 0.028 opioid growth factor receptor SREBF2 0.028 sterol regulatory element-binding transcription fact... TAF4 0.027 TBP-associated factor 4 SETD1A 0.026 SET domain containing 1A KRTAP4-6 0.026 PREDICTED: keratin associated protein 4.6 MNT 0.026 MAX binding protein CDKN1C 0.025 cyclin-dependent kinase inhibitor 1C isoform b [Hom... CDKN1C 0.025 cyclin-dependent kinase inhibitor 1C isoform b [Hom... CDKN1C 0.025 cyclin-dependent kinase inhibitor 1C isoform a HOXA13 0.025 homeobox A13 LBXCOR1 0.025 LBXCOR1 homolog ARX 0.025 aristaless related homeobox POU4F1 0.024 POU domain, class 4, transcription factor 1Human BLASTP results (used to prepare the table) | |||
Gene descriptions are from NCBI RefSeq. Search results were obtained with NCBI BLAST and RefSeq entries. When identical proteins are present, the self-match may not be listed first in BLASTP output. In such cases, the table above has been reordered to place it first.
See About the Figures for the scoring system used in the figure above right. The same scoring system was used in the table of BLASTP results.
Guide to the Human Genome
Copyright © 2010 by Stewart Scherer. All rights reserved.
