
| Name: SYNPR | Sequence: fasta or formatted (285aa) | NCBI GI: 194018518 | |
|
Description: synaptoporin isoform 1
|
Referenced in:
| ||
Other entries for this name:
alt prot [265aa] synaptoporin isoform 2 | |||
|
Composition:
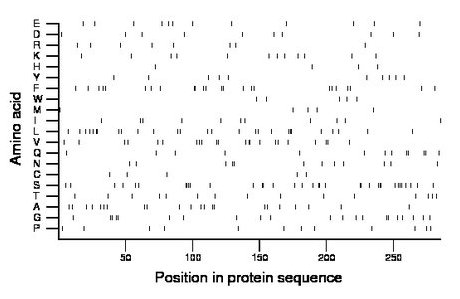
Amino acid Percentage Count Longest homopolymer A alanine 7.7 22 2 C cysteine 1.8 5 1 D aspartate 3.5 10 1 E glutamate 4.2 12 1 F phenylalanine 8.4 24 2 G glycine 7.4 21 2 H histidine 1.4 4 1 I isoleucine 3.9 11 1 K lysine 4.2 12 1 L leucine 9.5 27 3 M methionine 1.8 5 1 N asparagine 4.2 12 2 P proline 4.2 12 1 Q glutamine 4.6 13 2 R arginine 2.8 8 1 S serine 12.3 35 4 T threonine 5.3 15 1 V valine 7.7 22 2 W tryptophan 1.8 5 1 Y tyrosine 3.5 10 1 |
Comparative genomics:
Search single species RefSeq proteins at NCBI
Search summary 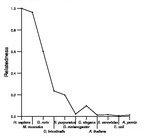
Figure data | ||
Related human proteins:Protein Relative score Description Self-match 1.000 synaptoporin isoform 1 SYNPR 0.905 synaptoporin isoform 2 SYP 0.573 synaptophysin SYPL2 0.385 mitsugumin 29 SYPL1 0.320 synaptophysin-like 1 isoform b SYPL1 0.320 synaptophysin-like 1 isoform a EWSR1 0.025 Ewing sarcoma breakpoint region 1 isoform 5 EWSR1 0.025 Ewing sarcoma breakpoint region 1 isoform 4 EWSR1 0.025 Ewing sarcoma breakpoint region 1 isoform 3 EWSR1 0.025 Ewing sarcoma breakpoint region 1 isoform 1 EWSR1 0.025 Ewing sarcoma breakpoint region 1 isoform 2 SYNGR1 0.018 synaptogyrin 1 isoform 1a SMO 0.018 smoothened SYNGR2 0.018 synaptogyrin 2 TGFBR3 0.015 transforming growth factor, beta receptor III FLG2 0.015 filaggrin family member 2 FZD6 0.013 frizzled 6 MYADM 0.013 myeloid-associated differentiation marker MYADM 0.013 myeloid-associated differentiation marker MYADM 0.013 myeloid-associated differentiation marker MYADM 0.013 myeloid-associated differentiation marker MYADM 0.013 myeloid-associated differentiation marker SYNGR1 0.013 synaptogyrin 1 isoform 1c SYNGR1 0.013 synaptogyrin 1 isoform 1b KDR 0.013 kinase insert domain receptor precursor HRNR 0.011 hornerin SYNGR3 0.011 synaptogyrin 3 ABCA5 0.009 ATP-binding cassette, sub-family A , member 5 ABCA5 0.009 ATP-binding cassette, sub-family A , member 5 FUS 0.009 fusion (involved in t(12;16) in malignant liposarcoma...Human BLASTP results (used to prepare the table) | |||
Gene descriptions are from NCBI RefSeq. Search results were obtained with NCBI BLAST and RefSeq entries. When identical proteins are present, the self-match may not be listed first in BLASTP output. In such cases, the table above has been reordered to place it first.
See About the Figures for the scoring system used in the figure above right. The same scoring system was used in the table of BLASTP results.
Guide to the Human Genome
Copyright © 2010 by Stewart Scherer. All rights reserved.
