| Name: ETNK2 | Sequence: fasta or formatted (386aa) | NCBI GI: 186659525 | |
|
Description: ethanolamine kinase 2
|
Referenced in:
| ||
|
Composition:

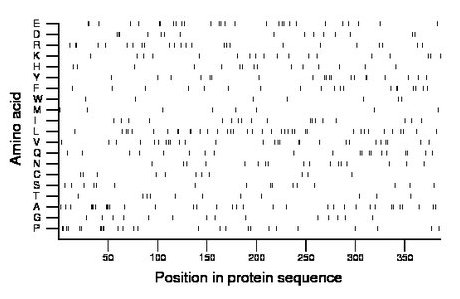
Amino acid Percentage Count Longest homopolymer A alanine 8.8 34 3 C cysteine 2.8 11 1 D aspartate 3.9 15 2 E glutamate 7.3 28 2 F phenylalanine 4.9 19 2 G glycine 3.6 14 1 H histidine 3.9 15 1 I isoleucine 4.7 18 2 K lysine 4.7 18 1 L leucine 9.8 38 2 M methionine 2.1 8 1 N asparagine 4.4 17 1 P proline 6.7 26 2 Q glutamine 5.2 20 1 R arginine 6.2 24 2 S serine 4.1 16 1 T threonine 2.8 11 1 V valine 7.0 27 2 W tryptophan 1.8 7 1 Y tyrosine 5.2 20 2 |
Comparative genomics:
Search single species RefSeq proteins at NCBI
Search summary 
Figure data | ||
Related human proteins:Protein Relative score Description Self-match 1.000 ethanolamine kinase 2 ETNK1 0.531 ethanolamine kinase 1 isoform A ETNK1 0.179 ethanolamine kinase 1 isoform B CHKB 0.175 choline kinase beta CHKA 0.139 choline kinase alpha isoform b CHKA 0.137 choline kinase alpha isoform a LOC100131908 0.013 PREDICTED: similar to forkhead box O6 ACAD10 0.013 acyl-Coenzyme A dehydrogenase family, member 10 iso... ACAD10 0.013 acyl-Coenzyme A dehydrogenase family, member 10 isof... ACAD10 0.013 acyl-Coenzyme A dehydrogenase family, member 10 iso... LOC339742 0.009 PREDICTED: hypothetical protein PPHLN1 0.009 periphilin 1 isoform 6 PPHLN1 0.009 periphilin 1 isoform 1 C1orf129 0.009 hypothetical protein LOC80133 MTMR15 0.008 myotubularin related protein 15 isoform a PEG10 0.008 paternally expressed 10 isoform RF1 PEG10 0.008 paternally expressed 10 isoform RF1/2 LOC100133638 0.006 PREDICTED: hypothetical protein LOC339742 0.006 PREDICTED: hypothetical protein ROBO3 0.006 roundabout, axon guidance receptor, homolog 3 HOXB2 0.006 homeobox B2 KCNK4 0.006 TRAAK ZNF575 0.006 zinc finger protein 575 TAOK2 0.006 TAO kinase 2 isoform 1 NLGN1 0.006 neuroligin 1 LOC100134240 0.005 PREDICTED: hypothetical protein GPR78 0.005 G protein-coupled receptor 78 ZNF526 0.005 zinc finger protein 526Human BLASTP results (used to prepare the table) | |||
Gene descriptions are from NCBI RefSeq. Search results were obtained with NCBI BLAST and RefSeq entries. When identical proteins are present, the self-match may not be listed first in BLASTP output. In such cases, the table above has been reordered to place it first.
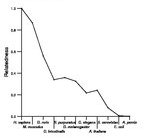
See About the Figures for the scoring system used in the figure above right. The same scoring system was used in the table of BLASTP results.
Guide to the Human Genome
Copyright © 2010 by Stewart Scherer. All rights reserved.
