
| Name: ID3 | Sequence: fasta or formatted (119aa) | NCBI GI: 156119621 | |
|
Description: inhibitor of DNA binding 3
|
Referenced in: Helix-Loop-Helix Transcription Factors
| ||
|
Composition:
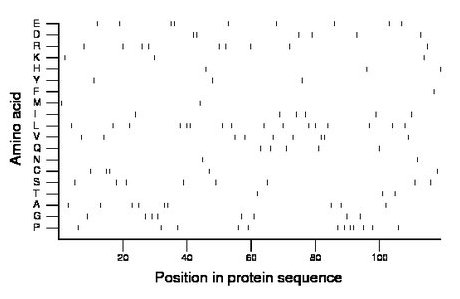
Amino acid Percentage Count Longest homopolymer A alanine 7.6 9 2 C cysteine 4.2 5 2 D aspartate 5.0 6 2 E glutamate 7.6 9 2 F phenylalanine 0.8 1 1 G glycine 6.7 8 1 H histidine 2.5 3 1 I isoleucine 5.0 6 1 K lysine 2.5 3 1 L leucine 13.4 16 2 M methionine 1.7 2 1 N asparagine 1.7 2 1 P proline 10.1 12 2 Q glutamine 4.2 5 1 R arginine 7.6 9 1 S serine 6.7 8 1 T threonine 2.5 3 1 V valine 7.6 9 2 W tryptophan 0.0 0 0 Y tyrosine 2.5 3 1 |
Comparative genomics:
Search single species RefSeq proteins at NCBI
Search summary 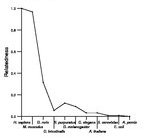
Figure data | ||
Related human proteins:Protein Relative score Description Self-match 1.000 inhibitor of DNA binding 3 ID2 0.269 inhibitor of DNA binding 2 ID1 0.260 inhibitor of DNA binding 1 isoform a ID1 0.260 inhibitor of DNA binding 1 isoform b ID4 0.260 inhibitor of DNA binding 4, dominant negative helix-l... HAND1 0.087 basic helix-loop-helix transcription factor HAND1 [Ho... TCF23 0.055 transcription factor 23 LOC100129654 0.055 PREDICTED: similar to transcription factor 23 [Homo... LOC100129654 0.055 PREDICTED: similar to transcription factor 23 [Homo... HAND2 0.055 basic helix-loop-helix transcription factor HAND2 [H... LOC100129654 0.046 PREDICTED: similar to transcription factor 23 [Homo... ASCL5 0.046 PREDICTED: achaete-scute complex homolog 5 (Drosoph... ASCL5 0.046 PREDICTED: achaete-scute complex homolog 5 (Drosoph... ASCL5 0.046 PREDICTED: achaete-scute complex homolog 5 ASCL4 0.046 achaete-scute complex-like 4 MSC 0.046 musculin ATOH7 0.046 atonal homolog 7 ATOH1 0.046 atonal homolog 1 TAL2 0.041 T-cell acute lymphocytic leukemia 2 NHLH2 0.037 nescient helix loop helix 2 NHLH2 0.037 nescient helix loop helix 2 TCF21 0.037 transcription factor 21 TCF21 0.037 transcription factor 21 NHLH1 0.037 nescient helix loop helix 1 NEUROG1 0.032 neurogenin 1 FIGLA 0.032 factor in the germline alpha ASCL1 0.027 achaete-scute complex homolog 1 ASCL2 0.027 achaete-scute complex homolog-like 2 LYL1 0.027 lymphoblastic leukemia derived sequence 1 SCXB 0.023 scleraxis homolog BHuman BLASTP results (used to prepare the table) | |||
Gene descriptions are from NCBI RefSeq. Search results were obtained with NCBI BLAST and RefSeq entries. When identical proteins are present, the self-match may not be listed first in BLASTP output. In such cases, the table above has been reordered to place it first.
See About the Figures for the scoring system used in the figure above right. The same scoring system was used in the table of BLASTP results.
Guide to the Human Genome
Copyright © 2010 by Stewart Scherer. All rights reserved.
