
| Name: GPR62 | Sequence: fasta or formatted (368aa) | NCBI GI: 145309315 | |
|
Description: G protein-coupled receptor 62
|
Referenced in:
| ||
|
Composition:
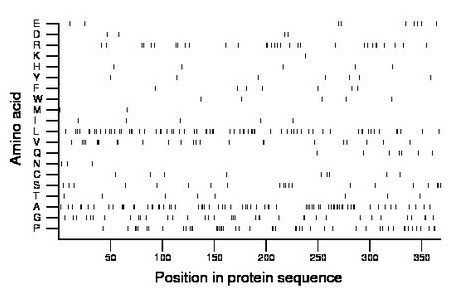
Amino acid Percentage Count Longest homopolymer A alanine 19.0 70 3 C cysteine 2.4 9 1 D aspartate 1.1 4 1 E glutamate 2.4 9 1 F phenylalanine 1.9 7 1 G glycine 9.8 36 2 H histidine 1.4 5 1 I isoleucine 1.4 5 1 K lysine 0.3 1 1 L leucine 18.5 68 4 M methionine 0.5 2 1 N asparagine 0.8 3 1 P proline 12.8 47 3 Q glutamine 1.9 7 1 R arginine 8.4 31 2 S serine 5.4 20 2 T threonine 2.2 8 1 V valine 6.5 24 3 W tryptophan 1.4 5 1 Y tyrosine 1.9 7 1 |
Comparative genomics:
Search single species RefSeq proteins at NCBI
Search summary 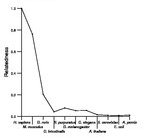
Figure data | ||
Related human proteins:Protein Relative score Description Self-match 1.000 G protein-coupled receptor 62 GPR61 0.184 G protein-coupled receptor 61 HTR6 0.090 5-hydroxytryptamine (serotonin) receptor 6 ADRB3 0.072 adrenergic, beta-3-, receptor KISS1R 0.066 G protein-coupled receptor 54 CCKBR 0.059 cholecystokinin B receptor ADRA1B 0.055 alpha-1B-adrenergic receptor HRH2 0.055 histamine receptor H2 isoform 1 HRH2 0.055 histamine receptor H2 isoform 2 GPR78 0.055 G protein-coupled receptor 78 P2RY11 0.052 purinergic receptor P2Y11 PPAN-P2RY11 0.052 PPAN-P2RY11 protein ADRA1D 0.049 alpha-1D-adrenergic receptor ADRA1A 0.048 alpha-1A-adrenergic receptor isoform 4 ADRA1A 0.048 alpha-1A-adrenergic receptor isoform 1 ADRA1A 0.048 alpha-1A-adrenergic receptor isoform 2 ADRA1A 0.048 alpha-1A-adrenergic receptor isoform 3 GPR135 0.045 G protein-coupled receptor 135 PRLHR 0.044 G protein-coupled receptor 10 UTS2R 0.041 urotensin 2 receptor SSTR4 0.040 somatostatin receptor 4 SSTR3 0.038 somatostatin receptor 3 HTR1B 0.038 5-hydroxytryptamine (serotonin) receptor 1B MTNR1B 0.038 melatonin receptor 1B PTGIR 0.038 prostaglandin I2 (prostacyclin) receptor (IP) DRD4 0.037 dopamine receptor D4 GALR3 0.037 galanin receptor 3 GALR2 0.034 galanin receptor 2 S1PR4 0.034 sphingosine-1-phosphate receptor 4 precursor TAAR6 0.032 trace amine associated receptor 6Human BLASTP results (used to prepare the table) | |||
Gene descriptions are from NCBI RefSeq. Search results were obtained with NCBI BLAST and RefSeq entries. When identical proteins are present, the self-match may not be listed first in BLASTP output. In such cases, the table above has been reordered to place it first.
See About the Figures for the scoring system used in the figure above right. The same scoring system was used in the table of BLASTP results.
Guide to the Human Genome
Copyright © 2010 by Stewart Scherer. All rights reserved.
