
| Name: BDP1 | Sequence: fasta or formatted (2624aa) | NCBI GI: 109637791 | |
|
Description: transcription factor-like nuclear regulator
|
Referenced in: RNA Polymerase and General Transcription Factors
| ||
|
Composition:
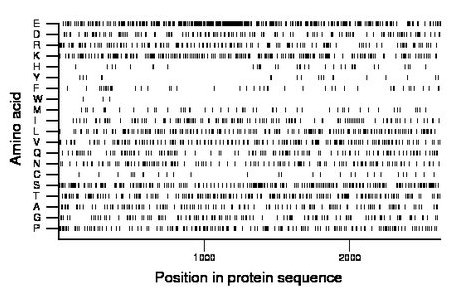
Amino acid Percentage Count Longest homopolymer A alanine 4.8 125 3 C cysteine 1.1 29 1 D aspartate 5.3 138 3 E glutamate 13.6 357 3 F phenylalanine 1.9 49 2 G glycine 4.5 118 2 H histidine 1.3 35 1 I isoleucine 4.6 120 2 K lysine 8.5 222 2 L leucine 6.7 176 3 M methionine 2.0 52 2 N asparagine 5.0 130 2 P proline 6.2 164 2 Q glutamine 4.6 122 2 R arginine 6.1 159 3 S serine 9.5 250 3 T threonine 7.0 183 3 V valine 6.5 170 2 W tryptophan 0.1 3 1 Y tyrosine 0.8 22 2 |
Comparative genomics:
Search single species RefSeq proteins at NCBI
Search summary 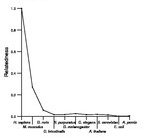
Figure data | ||
Related human proteins:Protein Relative score Description Self-match 1.000 transcription factor-like nuclear regulator CENPE 0.018 centromere protein E GOLGA4 0.014 golgi autoantigen, golgin subfamily a, 4 MYH10 0.012 myosin, heavy polypeptide 10, non-muscle EEA1 0.011 early endosome antigen 1, 162kD ERC1 0.011 RAB6-interacting protein 2 isoform delta KTN1 0.011 kinectin 1 isoform c ERC1 0.010 RAB6-interacting protein 2 isoform epsilon MYH9 0.010 myosin, heavy polypeptide 9, non-muscle GOLGB1 0.010 golgi autoantigen, golgin subfamily b, macrogolgin ... AKAP9 0.010 A-kinase anchor protein 9 isoform 3 NEFH 0.010 neurofilament, heavy polypeptide 200kDa WDR87 0.010 NYD-SP11 protein AKAP9 0.010 A-kinase anchor protein 9 isoform 2 PLEC1 0.010 plectin 1 isoform 11 PLEC1 0.010 plectin 1 isoform 10 PLEC1 0.010 plectin 1 isoform 8 PLEC1 0.010 plectin 1 isoform 7 PLEC1 0.010 plectin 1 isoform 6 PLEC1 0.010 plectin 1 isoform 3 PLEC1 0.010 plectin 1 isoform 2 PLEC1 0.010 plectin 1 isoform 1 KTN1 0.010 kinectin 1 isoform a KTN1 0.010 kinectin 1 isoform a MAP1B 0.010 microtubule-associated protein 1B EVPL 0.010 envoplakin MYH3 0.010 myosin, heavy chain 3, skeletal muscle, embryonic [H... TCHH 0.010 trichohyalin RBBP6 0.009 retinoblastoma-binding protein 6 isoform 2 RBBP6 0.009 retinoblastoma-binding protein 6 isoform 1Human BLASTP results (used to prepare the table) | |||
Gene descriptions are from NCBI RefSeq. Search results were obtained with NCBI BLAST and RefSeq entries. When identical proteins are present, the self-match may not be listed first in BLASTP output. In such cases, the table above has been reordered to place it first.
See About the Figures for the scoring system used in the figure above right. The same scoring system was used in the table of BLASTP results.
Guide to the Human Genome
Copyright © 2010 by Stewart Scherer. All rights reserved.
