
| Name: TAAR1 | Sequence: fasta or formatted (339aa) | NCBI GI: 21264324 | |
|
Description: trace amine associated receptor 1
|
Referenced in:
| ||
|
Composition:
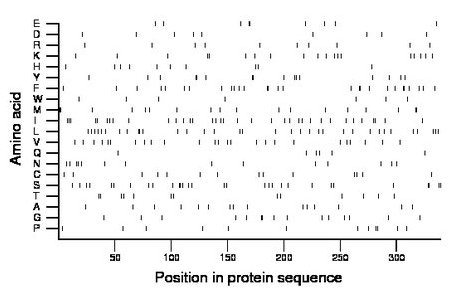
Amino acid Percentage Count Longest homopolymer A alanine 4.4 15 1 C cysteine 4.1 14 1 D aspartate 2.7 9 1 E glutamate 2.7 9 2 F phenylalanine 8.3 28 2 G glycine 4.4 15 2 H histidine 2.9 10 1 I isoleucine 10.3 35 2 K lysine 5.6 19 1 L leucine 10.0 34 2 M methionine 5.3 18 2 N asparagine 4.1 14 2 P proline 3.5 12 2 Q glutamine 1.8 6 1 R arginine 2.9 10 1 S serine 8.8 30 2 T threonine 3.8 13 2 V valine 7.4 25 1 W tryptophan 2.1 7 1 Y tyrosine 4.7 16 2 |
Comparative genomics:
Search single species RefSeq proteins at NCBI
Search summary 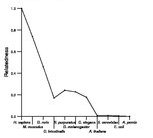
Figure data | ||
Related human proteins:Protein Relative score Description Self-match 1.000 trace amine associated receptor 1 TAAR2 0.447 trace amine associated receptor 2 isoform 1 TAAR2 0.430 trace amine associated receptor 2 isoform 2 TAAR9 0.391 trace amine associated receptor 9 TAAR6 0.375 trace amine associated receptor 6 TAAR8 0.364 trace amine associated receptor 8 TAAR5 0.348 trace amine associated receptor 5 HTR4 0.265 serotonin 5-HT4 receptor isoform n HTR4 0.265 serotonin 5-HT4 receptor isoform i HTR4 0.265 serotonin 5-HT4 receptor isoform d HTR4 0.265 serotonin 5-HT4 receptor isoform a HTR4 0.265 serotonin 5-HT4 receptor isoform g HTR4 0.265 serotonin 5-HT4 receptor isoform b HTR4 0.261 serotonin 5-HT4 receptor isoform hb HRH2 0.230 histamine receptor H2 isoform 1 HRH2 0.230 histamine receptor H2 isoform 2 HTR1D 0.218 5-hydroxytryptamine (serotonin) receptor 1D DRD1 0.215 dopamine receptor D1 DRD5 0.213 dopamine receptor D5 ADRB2 0.210 adrenergic, beta-2-, receptor, surface ADRB1 0.200 beta-1-adrenergic receptor ADRA1A 0.191 alpha-1A-adrenergic receptor isoform 4 ADRA1A 0.191 alpha-1A-adrenergic receptor isoform 1 ADRA1A 0.191 alpha-1A-adrenergic receptor isoform 2 ADRA1A 0.191 alpha-1A-adrenergic receptor isoform 3 HTR7 0.191 5-hydroxytryptamine receptor 7 isoform b HTR7 0.191 5-hydroxytryptamine receptor 7 isoform d HTR7 0.191 5-hydroxytryptamine receptor 7 isoform a HTR1F 0.190 5-hydroxytryptamine (serotonin) receptor 1F HTR6 0.185 5-hydroxytryptamine (serotonin) receptor 6Human BLASTP results (used to prepare the table) | |||
Gene descriptions are from NCBI RefSeq. Search results were obtained with NCBI BLAST and RefSeq entries. When identical proteins are present, the self-match may not be listed first in BLASTP output. In such cases, the table above has been reordered to place it first.
See About the Figures for the scoring system used in the figure above right. The same scoring system was used in the table of BLASTP results.
Guide to the Human Genome
Copyright © 2010 by Stewart Scherer. All rights reserved.
