
| Name: SLC3A2 | Sequence: fasta or formatted (568aa) | NCBI GI: 61744481 | |
|
Description: solute carrier family 3, member 2 isoform e
|
Referenced in:
| ||
Other entries for this name:
alt prot [661aa] solute carrier family 3, member 2 isoform a alt prot [631aa] solute carrier family 3, member 2 isoform b alt prot [599aa] solute carrier family 3, member 2 isoform d alt prot [529aa] solute carrier family 3, member 2 isoform f alt prot [630aa] solute carrier family 3, member 2 isoform c | |||
|
Composition:
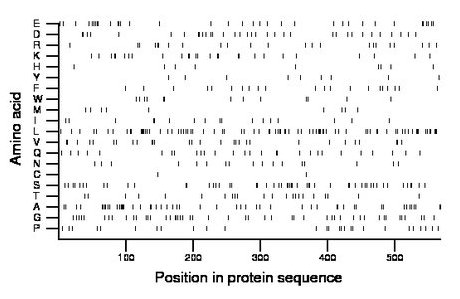
Amino acid Percentage Count Longest homopolymer A alanine 9.5 54 5 C cysteine 0.4 2 1 D aspartate 6.0 34 2 E glutamate 6.3 36 2 F phenylalanine 3.7 21 1 G glycine 8.5 48 1 H histidine 1.6 9 1 I isoleucine 3.0 17 2 K lysine 4.9 28 3 L leucine 15.0 85 4 M methionine 1.8 10 1 N asparagine 3.0 17 1 P proline 4.9 28 2 Q glutamine 4.9 28 2 R arginine 4.2 24 2 S serine 9.5 54 2 T threonine 3.9 22 1 V valine 5.1 29 2 W tryptophan 2.3 13 2 Y tyrosine 1.6 9 1 |
Comparative genomics:
Search single species RefSeq proteins at NCBI
Search summary 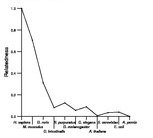
Figure data | ||
Related human proteins:Protein Relative score Description Self-match 1.000 solute carrier family 3, member 2 isoform e SLC3A2 0.985 solute carrier family 3, member 2 isoform d SLC3A2 0.960 solute carrier family 3, member 2 isoform c SLC3A2 0.958 solute carrier family 3, member 2 isoform b SLC3A2 0.936 solute carrier family 3, member 2 isoform a SLC3A2 0.932 solute carrier family 3, member 2 isoform f SLC3A1 0.091 solute carrier family 3, member 1 DDX55 0.007 DEAD (Asp-Glu-Ala-Asp) box polypeptide 55 LOC729020 0.006 rcRPE protein NOLC1 0.006 nucleolar and coiled-body phosphoprotein 1 ESYT2 0.006 family with sequence similarity 62 (C2 domain contai... VWDE 0.005 von Willebrand factor D and EGF domains PABPN1 0.005 poly(A) binding protein, nuclear 1 MDN1 0.005 MDN1, midasin homolog RNF19B 0.005 ring finger protein 19B isoform a RNF19B 0.005 ring finger protein 19B isoform b GPATCH1 0.005 G patch domain containing 1 SPON2 0.005 spondin 2, extracellular matrix protein SPON2 0.005 spondin 2, extracellular matrix protein RPE 0.005 ribulose-5-phosphate-3-epimerase isoform 2 RPE 0.005 ribulose-5-phosphate-3-epimerase isoform 1 SYNPO2 0.005 synaptopodin 2 isoform c SYNPO2 0.005 synaptopodin 2 isoform b SYNPO2 0.005 synaptopodin 2 isoform aHuman BLASTP results (used to prepare the table) | |||
Gene descriptions are from NCBI RefSeq. Search results were obtained with NCBI BLAST and RefSeq entries. When identical proteins are present, the self-match may not be listed first in BLASTP output. In such cases, the table above has been reordered to place it first.
See About the Figures for the scoring system used in the figure above right. The same scoring system was used in the table of BLASTP results.
Guide to the Human Genome
Copyright © 2010 by Stewart Scherer. All rights reserved.
