
| Name: FRS3 | Sequence: fasta or formatted (492aa) | NCBI GI: 5730059 | |
|
Description: fibroblast growth factor receptor substrate 3
|
Referenced in:
| ||
|
Composition:
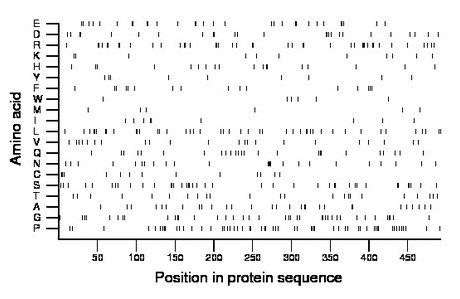
Amino acid Percentage Count Longest homopolymer A alanine 5.9 29 2 C cysteine 2.6 13 2 D aspartate 5.3 26 2 E glutamate 6.1 30 2 F phenylalanine 3.3 16 1 G glycine 8.1 40 2 H histidine 3.7 18 2 I isoleucine 1.8 9 2 K lysine 2.4 12 2 L leucine 8.9 44 2 M methionine 1.4 7 1 N asparagine 4.9 24 4 P proline 11.4 56 2 Q glutamine 5.1 25 2 R arginine 8.5 42 3 S serine 8.1 40 2 T threonine 4.9 24 2 V valine 4.5 22 1 W tryptophan 1.2 6 1 Y tyrosine 1.8 9 1 |
Comparative genomics:
Search single species RefSeq proteins at NCBI
Search summary 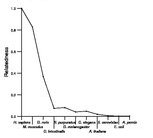
Figure data | ||
Related human proteins:Protein Relative score Description Self-match 1.000 fibroblast growth factor receptor substrate 3 FRS2 0.409 fibroblast growth factor receptor substrate 2 [Homo... FRS2 0.409 fibroblast growth factor receptor substrate 2 [Homo... DOK1 0.036 docking protein 1 DOK6 0.034 docking protein 6 DOK3 0.033 docking protein 3 isoform 1 DOK2 0.032 docking protein 2 DOK4 0.030 docking protein 4 DOK5 0.029 docking protein 5 SHANK1 0.022 SH3 and multiple ankyrin repeat domains 1 MLL4 0.015 myeloid/lymphoid or mixed-lineage leukemia 4 DOK7 0.015 downstream of tyrosine kinase 7 TET3 0.013 tet oncogene family member 3 SS18 0.012 synovial sarcoma translocation, chromosome 18 isofor... MLL2 0.012 myeloid/lymphoid or mixed-lineage leukemia 2 PRR12 0.010 proline rich 12 SYNJ1 0.010 synaptojanin 1 isoform d PRB1 0.010 proline-rich protein BstNI subfamily 1 isoform 1 pre... PCLO 0.009 piccolo isoform 2 PCLO 0.009 piccolo isoform 1 LOC100291634 0.008 PREDICTED: hypothetical protein XP_002346062 LOC100287232 0.008 PREDICTED: hypothetical protein XP_002342816 LOC100287232 0.008 PREDICTED: hypothetical protein MAP1A 0.008 microtubule-associated protein 1A SYNJ1 0.008 synaptojanin 1 isoform a NEDD4L 0.008 neural precursor cell expressed, developmentally do... NEDD4L 0.008 neural precursor cell expressed, developmentally dow... NEDD4L 0.008 neural precursor cell expressed, developmentally do... NEDD4L 0.008 neural precursor cell expressed, developmentally do... NEDD4L 0.008 neural precursor cell expressed, developmentally do...Human BLASTP results (used to prepare the table) | |||
Gene descriptions are from NCBI RefSeq. Search results were obtained with NCBI BLAST and RefSeq entries. When identical proteins are present, the self-match may not be listed first in BLASTP output. In such cases, the table above has been reordered to place it first.
See About the Figures for the scoring system used in the figure above right. The same scoring system was used in the table of BLASTP results.
Guide to the Human Genome
Copyright © 2010 by Stewart Scherer. All rights reserved.
