
| Name: SP5 | Sequence: fasta or formatted (398aa) | NCBI GI: 51468067 | |
|
Description: Sp5 transcription factor
|
Referenced in: Kruppel-related Zinc Finger Proteins
| ||
|
Composition:
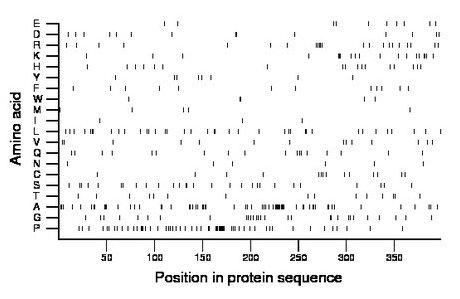
Amino acid Percentage Count Longest homopolymer A alanine 15.8 63 10 C cysteine 3.5 14 1 D aspartate 3.5 14 2 E glutamate 2.5 10 1 F phenylalanine 3.0 12 1 G glycine 7.3 29 2 H histidine 4.3 17 1 I isoleucine 0.8 3 1 K lysine 4.8 19 3 L leucine 9.5 38 2 M methionine 1.3 5 1 N asparagine 1.5 6 1 P proline 14.6 58 10 Q glutamine 4.5 18 1 R arginine 5.5 22 2 S serine 7.0 28 2 T threonine 3.8 15 1 V valine 3.5 14 1 W tryptophan 1.3 5 2 Y tyrosine 2.0 8 1 |
Comparative genomics:
Search single species RefSeq proteins at NCBI
Search summary 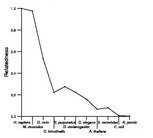
Figure data | ||
Related human proteins:Protein Relative score Description Self-match 1.000 Sp5 transcription factor SP4 0.235 Sp4 transcription factor SP3 0.224 Sp3 transcription factor isoform 2 SP3 0.224 Sp3 transcription factor isoform 1 SP1 0.222 Sp1 transcription factor isoform a SP1 0.222 Sp1 transcription factor isoform b SP9 0.215 Sp9 transcription factor homolog SP6 0.211 Sp6 transcription factor SP8 0.209 Sp8 transcription factor isoform 1 SP8 0.209 Sp8 transcription factor isoform 2 SP7 0.198 osterix SP2 0.176 Sp2 transcription factor KLF2 0.153 Kruppel-like factor KLF14 0.149 Kruppel-like factor 14 KLF11 0.149 Kruppel-like factor 11 KLF16 0.148 BTE-binding protein 4 KLF13 0.146 Kruppel-like factor 13 KLF10 0.141 Kruppel-like factor 10 isoform b KLF10 0.141 Kruppel-like factor 10 isoform a KLF9 0.138 Kruppel-like factor 9 KLF1 0.135 Kruppel-like factor 1 (erythroid) KLF15 0.124 Kruppel-like factor 15 KLF5 0.118 Kruppel-like factor 5 KLF4 0.118 Kruppel-like factor 4 (gut) KLF6 0.113 Kruppel-like factor 6 isoform A EGR2 0.111 early growth response 2 protein isoform b EGR2 0.111 early growth response 2 protein isoform a EGR2 0.111 early growth response 2 protein isoform a EGR2 0.111 early growth response 2 protein isoform a KLF7 0.110 Kruppel-like factor 7 (ubiquitous)Human BLASTP results (used to prepare the table) | |||
Gene descriptions are from NCBI RefSeq. Search results were obtained with NCBI BLAST and RefSeq entries. When identical proteins are present, the self-match may not be listed first in BLASTP output. In such cases, the table above has been reordered to place it first.
See About the Figures for the scoring system used in the figure above right. The same scoring system was used in the table of BLASTP results.
Guide to the Human Genome
Copyright © 2010 by Stewart Scherer. All rights reserved.
