
| Name: MFN1 | Sequence: fasta or formatted (741aa) | NCBI GI: 45269137 | |
|
Description: mitofusin 1
|
Referenced in: Mitochondria
| ||
|
Composition:
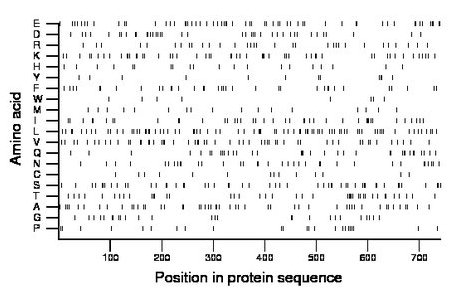
Amino acid Percentage Count Longest homopolymer A alanine 6.9 51 2 C cysteine 1.9 14 1 D aspartate 5.4 40 2 E glutamate 8.4 62 3 F phenylalanine 4.7 35 2 G glycine 3.6 27 2 H histidine 2.7 20 1 I isoleucine 5.5 41 3 K lysine 7.4 55 3 L leucine 10.9 81 2 M methionine 2.4 18 1 N asparagine 4.7 35 2 P proline 3.1 23 1 Q glutamine 4.9 36 2 R arginine 4.6 34 2 S serine 7.2 53 2 T threonine 5.7 42 2 V valine 7.3 54 2 W tryptophan 1.1 8 1 Y tyrosine 1.6 12 1 |
Comparative genomics:
Search single species RefSeq proteins at NCBI
Search summary 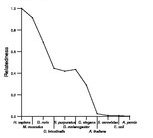
Figure data | ||
Related human proteins:Protein Relative score Description Self-match 1.000 mitofusin 1 MFN2 0.646 mitofusin 2 MFN2 0.646 mitofusin 2 MX1 0.013 myxovirus resistance protein 1 MX1 0.013 myxovirus resistance protein 1 HOMER1 0.010 homer 1 DST 0.010 dystonin isoform 1e precursor ROCK1 0.008 Rho-associated, coiled-coil containing protein kinase... OPA1 0.008 optic atrophy 1 isoform 5 OPA1 0.008 optic atrophy 1 isoform 3 OPA1 0.008 optic atrophy 1 isoform 2 OPA1 0.008 optic atrophy 1 isoform 1 MYO5C 0.008 myosin VC MACF1 0.007 microfilament and actin filament cross-linker protei... CYTSB 0.007 spectrin domain with coiled-coils 1 NSP5a3b CYTSB 0.007 spectrin domain with coiled-coils 1 NSP5a3a CYTSB 0.007 spectrin domain with coiled-coils 1 NSP5b3b CYTSB 0.007 spectrin domain with coiled-coils 1 NSP5b3a SMC1B 0.007 SMC1 structural maintenance of chromosomes 1-like 2 ... OPA1 0.007 optic atrophy 1 isoform 8 OPA1 0.007 optic atrophy 1 isoform 7 OPA1 0.007 optic atrophy 1 isoform 6 OPA1 0.007 optic atrophy 1 isoform 4 INPP4A 0.006 inositol polyphosphate-4-phosphatase, type 1 isofor... INPP4A 0.006 inositol polyphosphate-4-phosphatase, type 1 isoform ... INPP4A 0.006 inositol polyphosphate-4-phosphatase, type 1 isoform ... MYH9 0.006 myosin, heavy polypeptide 9, non-muscle LUM 0.006 lumican precursor MYH15 0.006 myosin, heavy polypeptide 15 NIN 0.006 ninein isoform 4Human BLASTP results (used to prepare the table) | |||
Gene descriptions are from NCBI RefSeq. Search results were obtained with NCBI BLAST and RefSeq entries. When identical proteins are present, the self-match may not be listed first in BLASTP output. In such cases, the table above has been reordered to place it first.
See About the Figures for the scoring system used in the figure above right. The same scoring system was used in the table of BLASTP results.
Guide to the Human Genome
Copyright © 2010 by Stewart Scherer. All rights reserved.
