
| Name: PDE1B | Sequence: fasta or formatted (536aa) | NCBI GI: 4505677 | |
|
Description: phosphodiesterase 1B
|
Referenced in: Calmodulin and Calcium
| ||
|
Composition:
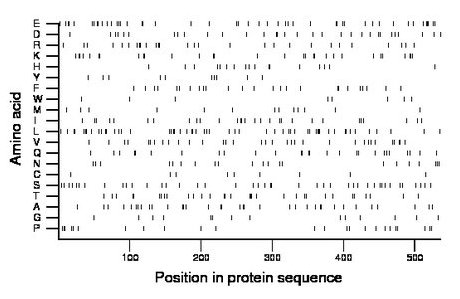
Amino acid Percentage Count Longest homopolymer A alanine 6.9 37 3 C cysteine 1.7 9 1 D aspartate 6.0 32 2 E glutamate 8.8 47 3 F phenylalanine 4.7 25 2 G glycine 2.6 14 1 H histidine 3.2 17 2 I isoleucine 5.4 29 2 K lysine 5.6 30 2 L leucine 10.4 56 3 M methionine 2.6 14 1 N asparagine 3.9 21 1 P proline 4.7 25 2 Q glutamine 5.0 27 2 R arginine 5.2 28 2 S serine 7.8 42 2 T threonine 6.0 32 2 V valine 6.2 33 2 W tryptophan 1.5 8 1 Y tyrosine 1.9 10 1 |
Comparative genomics:
Search single species RefSeq proteins at NCBI
Search summary 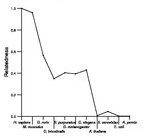
Figure data | ||
Related human proteins:Protein Relative score Description Self-match 1.000 phosphodiesterase 1B PDE1C 0.568 phosphodiesterase 1C PDE1A 0.565 phosphodiesterase 1A isoform 1 PDE1A 0.562 phosphodiesterase 1A isoform 2 PDE4C 0.203 phosphodiesterase 4C isoform PDE4C-2 PDE4C 0.203 phosphodiesterase 4C isoform PDE4C-3 PDE4C 0.203 phosphodiesterase 4C isoform PDE4C-1 PDE4D 0.199 phosphodiesterase 4D isoform 1 PDE4D 0.199 phosphodiesterase 4D isoform 2 PDE4B 0.198 phosphodiesterase 4B isoform 1 PDE4B 0.198 phosphodiesterase 4B isoform 3 PDE4B 0.198 phosphodiesterase 4B isoform 2 PDE4B 0.198 phosphodiesterase 4B isoform 1 PDE4A 0.196 phosphodiesterase 4A isoform 3 PDE4A 0.196 phosphodiesterase 4A isoform 2 PDE4A 0.196 phosphodiesterase 4A isoform 1 PDE4A 0.196 phosphodiesterase 4A isoform 4 PDE7A 0.143 phosphodiesterase 7A isoform a PDE7B 0.142 phosphodiesterase 7B PDE3A 0.137 phosphodiesterase 3A PDE3B 0.135 phosphodiesterase 3B PDE8A 0.133 phosphodiesterase 8A isoform 2 PDE8A 0.133 phosphodiesterase 8A isoform 1 PDE7A 0.130 phosphodiesterase 7A isoform b PDE9A 0.121 phosphodiesterase 9A isoform g PDE9A 0.121 phosphodiesterase 9A isoform g PDE9A 0.121 phosphodiesterase 9A isoform o PDE9A 0.121 phosphodiesterase 9A isoform n PDE9A 0.121 phosphodiesterase 9A isoform m PDE9A 0.121 phosphodiesterase 9A isoform jHuman BLASTP results (used to prepare the table) | |||
Gene descriptions are from NCBI RefSeq. Search results were obtained with NCBI BLAST and RefSeq entries. When identical proteins are present, the self-match may not be listed first in BLASTP output. In such cases, the table above has been reordered to place it first.
See About the Figures for the scoring system used in the figure above right. The same scoring system was used in the table of BLASTP results.
Guide to the Human Genome
Copyright © 2010 by Stewart Scherer. All rights reserved.
