
| Name: PAK2 | Sequence: fasta or formatted (524aa) | NCBI GI: 32483399 | |
|
Description: p21-activated kinase 2
|
Referenced in:
| ||
|
Composition:
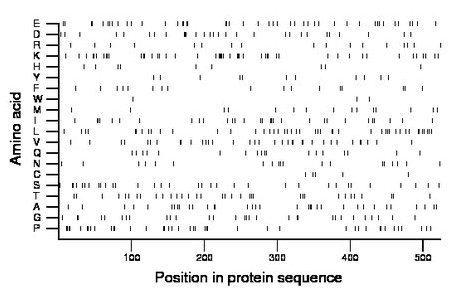
Amino acid Percentage Count Longest homopolymer A alanine 6.7 35 2 C cysteine 1.0 5 1 D aspartate 5.5 29 3 E glutamate 8.8 46 3 F phenylalanine 3.2 17 1 G glycine 5.7 30 2 H histidine 1.7 9 1 I isoleucine 5.7 30 2 K lysine 9.4 49 3 L leucine 8.6 45 2 M methionine 3.1 16 1 N asparagine 3.6 19 1 P proline 8.0 42 2 Q glutamine 3.4 18 1 R arginine 3.2 17 1 S serine 6.5 34 2 T threonine 6.5 34 1 V valine 6.7 35 2 W tryptophan 0.6 3 1 Y tyrosine 2.1 11 1 |
Comparative genomics:
Search single species RefSeq proteins at NCBI
Search summary 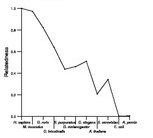
Figure data | ||
Related human proteins:Protein Relative score Description Self-match 1.000 p21-activated kinase 2 PAK1 0.762 p21-activated kinase 1 isoform 2 PAK3 0.751 p21-activated kinase 3 isoform a PAK3 0.751 p21-activated kinase 3 isoform a PAK3 0.751 p21-activated kinase 3 isoform a PAK3 0.742 p21-activated kinase 3 isoform d PAK3 0.740 p21-activated kinase 3 isoform c PAK3 0.734 p21-activated kinase 3 isoform b PAK1 0.722 p21-activated kinase 1 isoform 1 PAK4 0.326 p21-activated kinase 4 isoform 2 PAK4 0.326 p21-activated kinase 4 isoform 2 PAK4 0.291 p21-activated kinase 4 isoform 1 PAK4 0.291 p21-activated kinase 4 isoform 1 PAK4 0.291 p21-activated kinase 4 isoform 1 PAK6 0.280 p21-activated kinase 6 PAK6 0.280 p21-activated kinase 6 PAK6 0.280 p21-activated kinase 6 PAK7 0.276 p21-activated kinase 7 PAK7 0.276 p21-activated kinase 7 STK3 0.212 serine/threonine kinase 3 STK4 0.207 serine/threonine kinase 4 MST4 0.204 serine/threonine protein kinase MST4 isoform 1 [Homo... STK24 0.202 serine/threonine kinase 24 isoform b STK24 0.202 serine/threonine kinase 24 isoform a STK25 0.198 serine/threonine kinase 25 MAP4K2 0.178 mitogen-activated protein kinase kinase kinase kinas... MAP4K3 0.174 mitogen-activated protein kinase kinase kinase kinas... SLK 0.172 serine/threonine kinase 2 MYO3A 0.170 myosin IIIA MAP4K5 0.169 mitogen-activated protein kinase kinase kinase kinas...Human BLASTP results (used to prepare the table) | |||
Gene descriptions are from NCBI RefSeq. Search results were obtained with NCBI BLAST and RefSeq entries. When identical proteins are present, the self-match may not be listed first in BLASTP output. In such cases, the table above has been reordered to place it first.
See About the Figures for the scoring system used in the figure above right. The same scoring system was used in the table of BLASTP results.
Guide to the Human Genome
Copyright © 2010 by Stewart Scherer. All rights reserved.
