
| Name: EPN1 | Sequence: fasta or formatted (550aa) | NCBI GI: 41350201 | |
|
Description: epsin 1 isoform c
|
Referenced in:
| ||
Other entries for this name:
alt prot [576aa] epsin 1 isoform b alt prot [662aa] epsin 1 isoform a | |||
|
Composition:
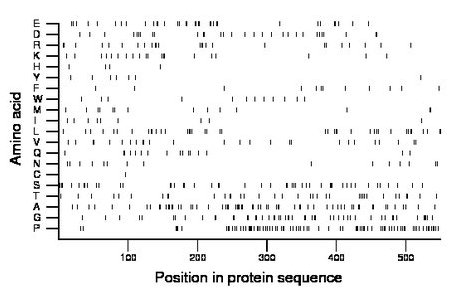
Amino acid Percentage Count Longest homopolymer A alanine 11.6 64 3 C cysteine 0.2 1 1 D aspartate 5.5 30 2 E glutamate 6.4 35 3 F phenylalanine 2.2 12 1 G glycine 9.5 52 3 H histidine 0.7 4 1 I isoleucine 1.6 9 1 K lysine 3.6 20 1 L leucine 7.3 40 2 M methionine 2.7 15 2 N asparagine 2.7 15 1 P proline 14.9 82 3 Q glutamine 2.9 16 2 R arginine 4.5 25 2 S serine 8.7 48 3 T threonine 6.7 37 2 V valine 4.7 26 2 W tryptophan 2.2 12 1 Y tyrosine 1.3 7 1 |
Comparative genomics:
Search single species RefSeq proteins at NCBI
Search summary 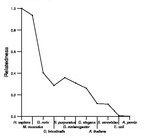
Figure data | ||
Related human proteins:Protein Relative score Description Self-match 1.000 epsin 1 isoform c EPN1 0.995 epsin 1 isoform a EPN1 0.983 epsin 1 isoform b EPN2 0.416 epsin 2 isoform a EPN3 0.351 epsin 3 EPN2 0.346 epsin 2 isoform b ENTHD1 0.167 ENTH domain containing 1 EPN2 0.147 epsin 2 isoform c CLINT1 0.130 epsin 4 NACA 0.058 nascent polypeptide-associated complex alpha subuni... MLL2 0.051 myeloid/lymphoid or mixed-lineage leukemia 2 SRCAP 0.046 Snf2-related CBP activator protein TAF4 0.045 TBP-associated factor 4 FLJ22184 0.043 PREDICTED: hypothetical protein LOC80164 SETD1B 0.042 SET domain containing 1B TPRX1 0.042 tetra-peptide repeat homeobox SF1 0.041 splicing factor 1 isoform 2 MUC2 0.041 mucin 2 precursor NCOR2 0.041 nuclear receptor co-repressor 2 isoform 1 LMTK3 0.041 lemur tyrosine kinase 3 FLJ22184 0.040 PREDICTED: hypothetical protein FLJ22184 KIAA0754 0.040 hypothetical protein LOC643314 NCOR2 0.040 nuclear receptor co-repressor 2 isoform 2 BAT2 0.040 HLA-B associated transcript-2 SF1 0.040 splicing factor 1 isoform 1 SMARCA4 0.039 SWI/SNF-related matrix-associated actin-dependent r... SMARCA4 0.039 SWI/SNF-related matrix-associated actin-dependent r... SMARCA4 0.039 SWI/SNF-related matrix-associated actin-dependent r... SMARCA4 0.039 SWI/SNF-related matrix-associated actin-dependent r... SMARCA4 0.039 SWI/SNF-related matrix-associated actin-dependent r...Human BLASTP results (used to prepare the table) | |||
Gene descriptions are from NCBI RefSeq. Search results were obtained with NCBI BLAST and RefSeq entries. When identical proteins are present, the self-match may not be listed first in BLASTP output. In such cases, the table above has been reordered to place it first.
See About the Figures for the scoring system used in the figure above right. The same scoring system was used in the table of BLASTP results.
Guide to the Human Genome
Copyright © 2010 by Stewart Scherer. All rights reserved.
