
| Name: WWC3 | Sequence: fasta or formatted (1092aa) | NCBI GI: 38570149 | |
|
Description: WWC family member 3
|
Referenced in: BCL2 Pathways, Caspases, and Programmed Cell Death
| ||
|
Composition:
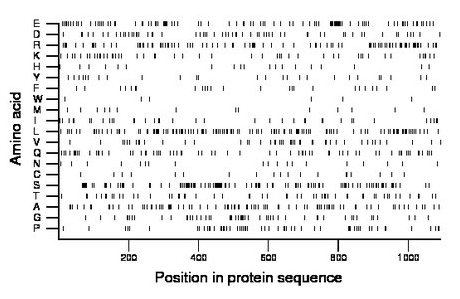
Amino acid Percentage Count Longest homopolymer A alanine 8.1 88 2 C cysteine 1.8 20 2 D aspartate 5.8 63 2 E glutamate 9.1 99 3 F phenylalanine 2.5 27 2 G glycine 4.8 52 2 H histidine 1.8 20 2 I isoleucine 3.4 37 2 K lysine 4.6 50 2 L leucine 11.4 124 2 M methionine 1.4 15 1 N asparagine 1.7 19 1 P proline 5.7 62 3 Q glutamine 6.4 70 3 R arginine 9.1 99 2 S serine 10.4 114 2 T threonine 5.0 55 2 V valine 4.2 46 1 W tryptophan 0.5 6 1 Y tyrosine 2.4 26 1 |
Comparative genomics:
Search single species RefSeq proteins at NCBI
Search summary 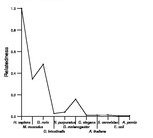
Figure data | ||
Related human proteins:Protein Relative score Description Self-match 1.000 WWC family member 3 WWC2 0.348 WW and C2 domain containing 2 WWC1 0.321 WW and C2 domain containing 1 isoform 3 WWC1 0.321 WW and C2 domain containing 1 isoform 2 WWC1 0.320 WW and C2 domain containing 1 isoform 1 PLEC1 0.015 plectin 1 isoform 11 PLEC1 0.015 plectin 1 isoform 10 PLEC1 0.015 plectin 1 isoform 8 PLEC1 0.015 plectin 1 isoform 7 PLEC1 0.015 plectin 1 isoform 6 PLEC1 0.015 plectin 1 isoform 3 PLEC1 0.015 plectin 1 isoform 2 PLEC1 0.015 plectin 1 isoform 1 SLMAP 0.015 sarcolemma associated protein ERC2 0.013 cytomatrix protein p110 MYH9 0.013 myosin, heavy polypeptide 9, non-muscle LOC728080 0.011 PREDICTED: similar to Golgin subfamily A member 8-l... LOC728047 0.011 PREDICTED: similar to Golgin subfamily A member 8-l... CGN 0.011 cingulin GOLGB1 0.011 golgi autoantigen, golgin subfamily b, macrogolgin ... LOC727909 0.011 PREDICTED: similar to Golgin subfamily A member 8-l... MYH10 0.011 myosin, heavy polypeptide 10, non-muscle DST 0.011 dystonin isoform 1e precursor TPR 0.011 nuclear pore complex-associated protein TPR MYH7B 0.011 myosin, heavy polypeptide 7B, cardiac muscle, beta ... LOC728080 0.011 PREDICTED: similar to Golgin subfamily A member 8-l... LOC728047 0.011 PREDICTED: similar to Golgin subfamily A member 8-l... NUMA1 0.011 nuclear mitotic apparatus protein 1 MYH6 0.011 myosin heavy chain 6 LOC727909 0.010 PREDICTED: similar to Golgin subfamily A member 8-l...Human BLASTP results (used to prepare the table) | |||
Gene descriptions are from NCBI RefSeq. Search results were obtained with NCBI BLAST and RefSeq entries. When identical proteins are present, the self-match may not be listed first in BLASTP output. In such cases, the table above has been reordered to place it first.
See About the Figures for the scoring system used in the figure above right. The same scoring system was used in the table of BLASTP results.
Guide to the Human Genome
Copyright © 2010 by Stewart Scherer. All rights reserved.
