
| Name: OTOF | Sequence: fasta or formatted (1230aa) | NCBI GI: 35493860 | |
|
Description: otoferlin isoform d
|
Referenced in: Auditory and Vestibular Functions
| ||
Other entries for this name:
alt prot [1997aa] otoferlin isoform a alt prot [1307aa] otoferlin isoform c alt prot [1230aa] otoferlin isoform b | |||
|
Composition:
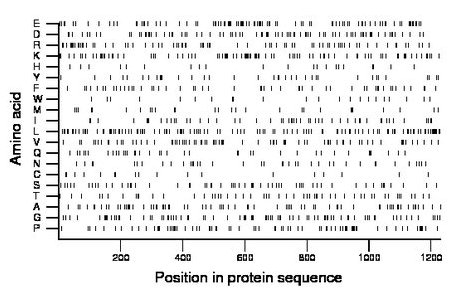
Amino acid Percentage Count Longest homopolymer A alanine 6.0 74 2 C cysteine 1.5 19 2 D aspartate 6.8 84 3 E glutamate 8.5 105 4 F phenylalanine 4.3 53 2 G glycine 6.4 79 1 H histidine 1.7 21 1 I isoleucine 4.5 55 2 K lysine 8.0 99 6 L leucine 10.1 124 2 M methionine 2.4 30 2 N asparagine 3.3 40 2 P proline 6.4 79 2 Q glutamine 3.3 40 2 R arginine 6.0 74 2 S serine 5.0 62 2 T threonine 4.3 53 2 V valine 6.5 80 3 W tryptophan 1.9 23 2 Y tyrosine 2.9 36 2 |
Comparative genomics:
Search single species RefSeq proteins at NCBI
Search summary 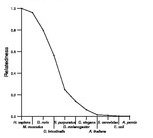
Figure data | ||
Related human proteins:Protein Relative score Description Self-match 1.000 otoferlin isoform d OTOF 0.987 otoferlin isoform b OTOF 0.982 otoferlin isoform c OTOF 0.982 otoferlin isoform a FER1L6 0.488 fer-1-like 6 DYSF 0.279 dysferlin isoform 1 DYSF 0.279 dysferlin isoform 5 DYSF 0.279 dysferlin isoform 6 DYSF 0.279 dysferlin isoform 14 DYSF 0.279 dysferlin isoform 11 DYSF 0.279 dysferlin isoform 10 DYSF 0.276 dysferlin isoform 2 DYSF 0.276 dysferlin isoform 8 DYSF 0.276 dysferlin isoform 3 DYSF 0.276 dysferlin isoform 4 DYSF 0.276 dysferlin isoform 7 DYSF 0.276 dysferlin isoform 13 DYSF 0.276 dysferlin isoform 12 DYSF 0.276 dysferlin isoform 9 MYOF 0.263 myoferlin isoform b MYOF 0.263 myoferlin isoform a FER1L5 0.159 fer-1-like 5 isoform 1 FER1L5 0.156 fer-1-like 5 isoform 2 RASAL1 0.016 RAS protein activator like 1 LOC100132214 0.012 PREDICTED: similar to calcium-promoted Ras inactiva... LOC100132214 0.012 PREDICTED: similar to calcium-promoted Ras inactiva... LOC100132214 0.012 PREDICTED: similar to calcium-promoted Ras inactiva... LOC100132214 0.012 PREDICTED: similar to calcium-promoted Ras inactiva... RASA4 0.012 RAS p21 protein activator 4 isoform 2 RASA4 0.012 RAS p21 protein activator 4 isoform 1Human BLASTP results (used to prepare the table) | |||
Gene descriptions are from NCBI RefSeq. Search results were obtained with NCBI BLAST and RefSeq entries. When identical proteins are present, the self-match may not be listed first in BLASTP output. In such cases, the table above has been reordered to place it first.
See About the Figures for the scoring system used in the figure above right. The same scoring system was used in the table of BLASTP results.
Guide to the Human Genome
Copyright © 2010 by Stewart Scherer. All rights reserved.
