
| Name: PEG3 | Sequence: fasta or formatted (1588aa) | NCBI GI: 33354285 | |
|
Description: paternally expressed 3 isoform 1
|
Referenced in: Kruppel-related Zinc Finger Proteins
| ||
Other entries for this name:
alt mRNA [1588aa] paternally expressed 3 isoform 1 alt prot [1462aa] paternally expressed 3 isoform 2 alt mRNA [1588aa] paternally expressed 3 isoform 1 alt prot [1464aa] paternally expressed 3 isoform 3 | |||
|
Composition:
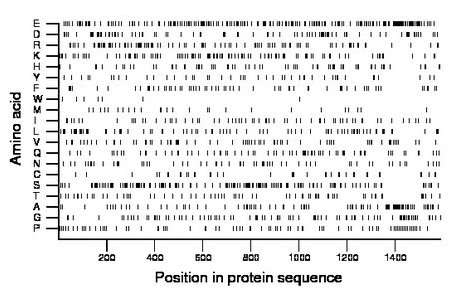
Amino acid Percentage Count Longest homopolymer A alanine 5.8 92 9 C cysteine 2.5 39 1 D aspartate 6.0 95 3 E glutamate 12.4 197 5 F phenylalanine 4.0 63 2 G glycine 5.8 92 2 H histidine 4.1 65 1 I isoleucine 4.1 65 2 K lysine 6.6 105 3 L leucine 5.4 86 2 M methionine 1.7 27 1 N asparagine 3.7 59 2 P proline 5.1 81 2 Q glutamine 4.4 70 2 R arginine 6.6 105 2 S serine 9.6 152 3 T threonine 4.4 70 1 V valine 4.4 70 2 W tryptophan 0.4 7 1 Y tyrosine 3.0 48 2 |
Comparative genomics:
Search single species RefSeq proteins at NCBI
Search summary 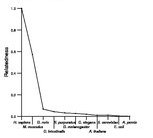
Figure data | ||
Related human proteins:Protein Relative score Description Self-match 1.000 paternally expressed 3 isoform 1 PEG3 1.000 paternally expressed 3 isoform 1 PEG3 1.000 paternally expressed 3 isoform 1 PEG3 0.920 paternally expressed 3 isoform 2 PEG3 0.917 paternally expressed 3 isoform 3 ZNF91 0.094 zinc finger protein 91 ZIM2 0.082 zinc finger, imprinted 2 ZIM2 0.082 zinc finger, imprinted 2 ZIM2 0.082 zinc finger, imprinted 2 ZNF721 0.081 zinc finger protein 721 ZNF208 0.081 zinc finger protein 208 LOC100292052 0.079 PREDICTED: similar to hCG1773661 LOC100287226 0.079 PREDICTED: similar to hCG1773661 LOC100287226 0.079 PREDICTED: hypothetical protein XP_002343677 ZNF287 0.076 zinc finger protein 287 ZNF99 0.070 zinc finger protein 99 ZNF135 0.069 zinc finger protein 135 ZNF420 0.068 zinc finger protein 420 ZNF658 0.068 zinc finger protein 658 ZNF167 0.068 zinc finger protein 167 isoform 1 ZFP62 0.065 zinc finger protein 62 homolog ZNF184 0.064 zinc finger protein 184 ZNF594 0.064 zinc finger protein 594 ZNF629 0.063 zinc finger protein 629 ZNF624 0.062 zinc finger protein 624 ZNF780B 0.061 zinc finger protein 780B ZNF836 0.060 zinc finger protein 836 ZNF107 0.059 zinc finger protein 107 ZNF107 0.059 zinc finger protein 107 ZKSCAN5 0.058 zinc finger with KRAB and SCAN domains 5Human BLASTP results (used to prepare the table) | |||
Gene descriptions are from NCBI RefSeq. Search results were obtained with NCBI BLAST and RefSeq entries. When identical proteins are present, the self-match may not be listed first in BLASTP output. In such cases, the table above has been reordered to place it first.
See About the Figures for the scoring system used in the figure above right. The same scoring system was used in the table of BLASTP results.
Guide to the Human Genome
Copyright © 2010 by Stewart Scherer. All rights reserved.
